Making the Case for Managed Volatility Part 1: Why Now?
With the potential to deliver equity-like returns with lower expected volatility over the long run, we believe the appeal of managed-volatility exposure within a broader portfolio is apparent. Depending on how the allocation is funded (meaning which combination of traditional stocks and bonds are sold to purchase low-volatility equity), it can allow for potentially higher expected returns, lower expected volatility, or both.
In the two part Making the Case for Managed Volatility series, we will highlight how current valuations support the current case for managed-volatility strategies and how changing inflation expectations should support relative returns going forward.
Greed over fear for the past year
Investor optimism gyrated between growth and value stocks over the last 12 months, although it was almost exclusively between “risky” growth and “risky” value stocks that exhibited higher volatility than the market. This preference to pay for “lottery-like” returns bid up the prices of riskier stocks, while stocks that exhibited more stable characteristics lagged. As enthusiasm waned for mega-cap technology growth stocks at the end of 2020, investors looked to companies that stood to benefit from pent-up consumer demand. Vaccine announcements in the fourth quarter of 2020 triggered a rotation away from “stay at home” stocks into beaten-down “reopening” plays. Exhibit 1 shows that the dynamic was common in all corners of the world as the low-volatility factor lagged globally.
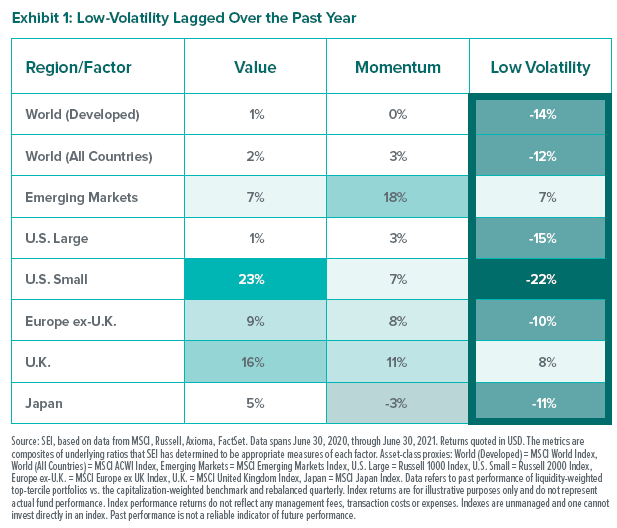
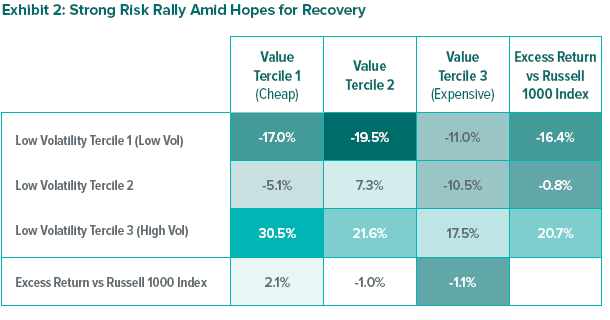
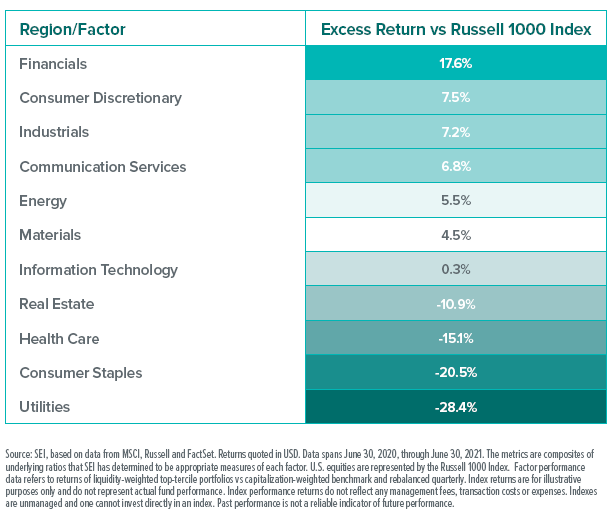
Exhibit 2 shows that pro-cyclical sectors within the U.S.—such as financials, consumer discretionary and industrials—benefited from the recovery environment, and that defensive utilities, consumers staples and health care underperformed. Within riskier names, “cheap” stocks rebounded most significantly, while more expensive names outperformed among defensive, low-volatility stocks.
Where do we go from here?
We believe that strategically, managed-volatility strategies are likely to retain their long-term properties of market-like returns with lower risk. In the long-run, an investor who stays away from “popular” and riskier areas of the market should be able to compound and receive market-like returns with significantly lower risk.
The pandemic-related selloff was an exception because it was not economically driven. It was an exogenous, healthcare-driven event. As much as that exception disappointed managed-volatility investors, we do not believe that it should be over extrapolated. Most shocks are market driven, and we should expect managed volatility to deliver on its long-term properties over full market cycles.
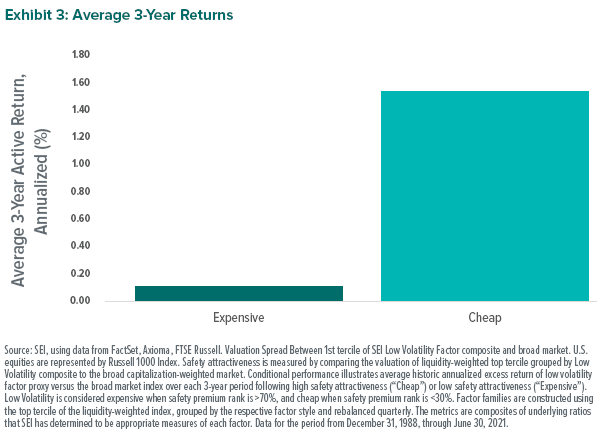
Valuation matters
It should be common sense that buying something cheap is better than buying it at a higher price. Accordingly, one would expect better returns from low-volatility when it is cheap. Exhibit 3, which looks at the performance of low-volatility equities over three years based on their starting valuation, supports this premise.
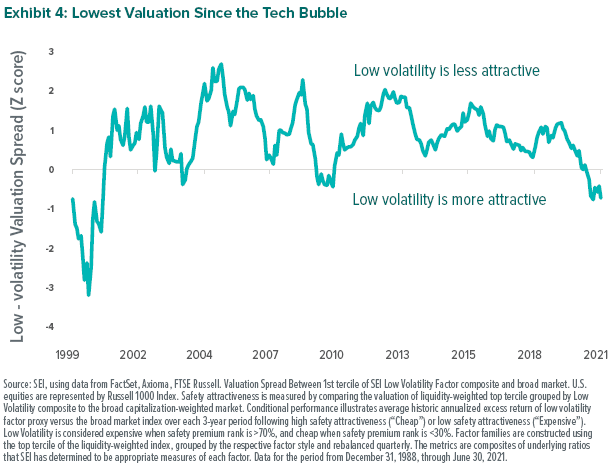
As Exhibit 4 shows, current valuations are likely to provide a cushion for managed-volatility strategies in a broad market correction as low-volatility equities are now cheaper than at any point over the last two decades.
SEI’s view
Naturally, higher risk-adjusted returns afford investors greater confidence in their ability to achieve their financial goals. Particularly at the lower-risk end of the spectrum, where many investors are concerned primarily with the risk of absolute loss, managed volatility can allow for the possibility of significant long-term growth with potentially smaller expected drawdowns.
In Making the Case for Managed Volatility Part 2: What Matters? we will examine the impact of inflationary expectations on managed-volatility strategies and how higher inflation by itself does not necessarily signify a negative environment.
Glossary
Bear market refers to a period of steadily decreasing stock prices, typically marked by a 20% drop from recent highs.
Bull market refers to a period of steadily increasing stock prices.
Composite refers to a combination of several measurements or data types.
Full market cycle refers to a period of time containing a wide variety of economic trends and market environments, generally including a bull market through a bear market and back again to the start of a new bull market.
Growth stocks exhibit steady price or earnings growth above that of the broader market.
Mega-cap stocks are companies with market capitalizations over $200 billion.
Pro-cyclical stocks tend to be correlated with the overall economy and typically increase when the economy is growing quickly.
SEI Low Volatility Factor Composite is a composite index of underlying ratios that SEI has determined to be appropriate measures of the low-volatility factor.
SEI Value Factor Family is a composite index of underlying ratios that SEI has determined to be appropriate measures of the value factor.
Spread refers to the difference between two values.
Tercile is a number that divides an ordered set of data into three parts, each containing a third of the values.
Value stocks are those that are considered to be cheap and are trading for less than they are worth.
Z-score describes a value’s relationship to the average of a larger set of data.
Index Definitions
MSCI ACWI Index measures the activity of large- and mid-cap stocks in developed- and emerging-market countries.
MSCI Emerging Markets Index is a free float-adjusted market-capitalization-weighted index designed to measure the performance of global emerging-market equities.
MSCI Europe ex UK Index is designed to measure the performance of large- and mid-cap stocks in developed-market countries (excluding the U.K.) in Europe.
MSCI Japan Index is designed to measure the performance of large- and mid-cap stocks in Japan.
MSCI United Kingdom Index is designed to measure the performance of large- and mid-cap stocks in the U.K.
MSCI World Index measures the activity of large- and mid-cap stocks in developed-market countries.
Russell 1000 Index measures the activity of the U.S. large-cap equity market.
Russell 2000 Index measures the activity of the U.S. small-cap equity market.
S&P Developed Large Midcap Index measures the performance of stocks representing the top 85% of float-adjusted market cap in each developed country.
Important Information
This material represents an assessment of the market environment at a specific point in time and is not intended to be a forecast of future events or a guarantee of future results. Positioning and holdings are subject to change. All information as of the date indicated. This information should not be relied upon by the reader as research or investment advice, (unless you have otherwise separately entered into a written agreement with SEI for the provision of investment advice) nor should it be construed as a recommendation to purchase or sell a security. The reader should consult with their financial professional for more information.
Statements that are not factual in nature, including opinions, projections and estimates, assume certain economic conditions and industry developments and constitute only current opinions that are subject to change without notice. Nothing herein is intended to be a forecast of future events, or a guarantee of future results.
Certain economic and market information contained herein has been obtained from published sources prepared by other parties, which in certain cases have not been updated through the date hereof. While such sources are believed to be reliable, neither SEI nor its affiliates assumes any responsibility for the accuracy or completeness of such information and such information has not been independently verified by SEI.
There are risks involved with investing, including loss of principal. The value of an investment and any income from it can go down as well as up. Investors may get back less than the original amount invested. Returns may increase or decrease as a result of currency fluctuations. Past performance is not a reliable indicator of future results. Investment may not be suitable for everyone.
This material is not directed to any persons where (by reason of that person’s nationality, residence or otherwise) the publication or availability of this material is prohibited. Persons in respect of whom such prohibitions apply must not rely on this information in any respect whatsoever.
The information contained herein is for general and educational information purposes only and is not intended to constitute legal, tax, accounting, securities, research or investment advice regarding the strategies or any security in particular, nor an opinion regarding the appropriateness of any investment. This information should not be construed as a recommendation to purchase or sell a security, derivative or futures contract. You should not act or rely on the information contained herein without obtaining specific legal, tax, accounting and investment advice from an investment professional.
Information in the U.S. is provided by SEI Investments Management Corporation (SIMC), a wholly owned subsidiary of SEI Investments Company (SEI).
Information provided in Canada by SEI Investments Canada Company, the Manager of the SEI Funds in Canada.
Information issued in the UK by SEI Investments (Europe) Limited, 1st Floor, Alphabeta, 14-18 Finsbury Square, London EC2A 1BR which is authorised and regulated by the Financial Conduct Authority. Investments in SEI Funds are generally medium- to long-term investments.
SIEL has appointed SEI Investments (Asia) Limited (SEIAL) of Suite 904, The Hong Kong Club Building, 3 Jackson Road, Central, Hong Kong as the sub-distributor of the SEI UCITS funds. SEIAL is licensed for Type 4 and 9 regulated activities under the Securities and Futures Commission (“SFC”)
This information is being made available in Hong Kong by SEIAL. The contents of this document have not been reviewed by any regulatory authority in Hong Kong. You are advised to exercise caution in relation to the offer. If you are in any doubt about any of the contents of this document, you should obtain independent professional advice.
This information is made available in Latin America FOR PROFESSIONAL (non-retail) USE ONLY by SIEL.
Any questions you may have in relation to its contents should solely be directed to your Distributor. If you do not know who your Distributor is, then you cannot rely on any part of this document in any respect whatsoever.
Issued in South Africa by SEI Investment (South Africa) (Pty) Limited FSP No. 13186 which is a financial services provider authorised and regulated by the Financial Sector Conduct Authority (FSCA). Registered office: 3 Melrose Boulevard, 1st Floor, Melrose Arch 2196, Johannesburg, South Africa.


