Looking Beyond the Fear: An Analysis of Sharp Selloffs
Looking Beyond the Fear: An Analysis of Sharp Selloffs
- COVID-19’s spread and containment efforts have forced market prices to recalibrate sharply as expectations about different industries and the overall economy have shifted at a breakneck pace.
- This fallout—while new and uncomfortable—represents a tiny part of the market’s forward-looking focus.
- Sharp selloffs provide an opportunity to own investments at inexpensive levels under historical conditions that should inspire confidence
What do stock-market prices tell us? Lately, they’ve been telling us that investors are afraid. They also suggest that stocks are beginning to look like a bargain.
Putting a Price on Stocks: What’s it Worth Today?
Academics characterise stock markets as forward looking discounting mechanisms. More simply stated, this means that, as a collective group, investors use all available information about the future in an effort to put a value on a company.
This exercise—in which forward-looking expectations produce a current price—is known as discounted earnings analysis. It’s based on the idea that we can determine the current value of a future payment or income stream by “discounting” it backward through time at a pre-determined rate. Scaled up from individual companies to the market level, pricing should reflect all available information about the future earnings potential of the market, serving as a partial proxy for the economy.
Rapid Repricing Resembles Panic
Armed with this understanding of how new information gets factored into prices, we can sympathise with the challenge presented by a quickly evolving (or deteriorating) environment. The onslaught of developments presented by COVID-19’s spread and a simultaneous collapse in oil prices has forced financial markets to recalibrate prices sharply as expectations about different industries and the overall economy shift at a breakneck pace.
What’s it Worth in the Future?
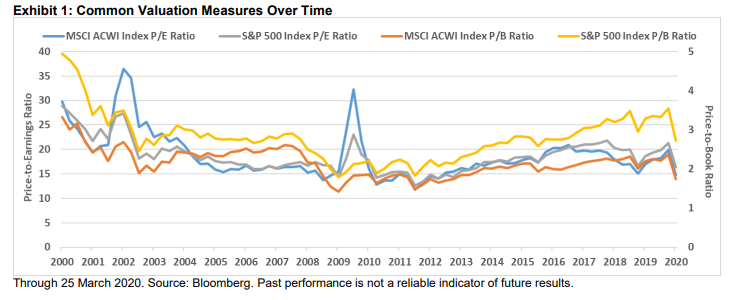
One way to think about the market’s forward-looking focus is with well-known metrics like the price-toearnings (P/E) or price-to-book (P/B) ratios. The MSCI ACWI Index and S&P 500 Index had trailing P/E ratios of approximately 15 on 25 March 2020, meaning that investors must pay a price equal to 15 times the estimated annual earnings of its constituent companies to buy them. That’s the next 60 quarters of earnings.
There’s some reassurance in the fact that a COVID-19- containment-induced earnings recession is generally only expected to last a couple quarters or so. If market prices are based on the next 60 quarters, then this fallout—while new and uncomfortable—represents a tiny part of the market’s forward-looking focus.
Not Quite a Silver Lining
A couple quarters of poor earnings are not going to create permanent damage for a well-designed long-term investment strategy. But we understand that it’s also not going to make investors feel better about the value of their accounts today.
The aforementioned ratios are fundamental measures used to help determine the underlying value of a stock, index or market. They tell us whether an investment is cheap or expensive according to a given measure. They don’t, however, make any claim about the future direction of prices over any specific time frame. Technical measures, on the other hand, track the price of a stock, index or market as a standalone measure.
Technicals use historical prices and patterns to help develop forward-looking expectations about price direction. Sharp selloffs can produce what market technicians describe as “oversold” levels. We can use the 200-day simple moving average (that is, a stock’s average price over the last 200 days) as a measure of whether the math suggests that it’s oversold, or has fallen too far, too fast.
If we look at the price of each constituent stock in the S&P 500 Index relative to its own 200-day moving average, we can estimate the extent to which U.S. stocks are oversold.
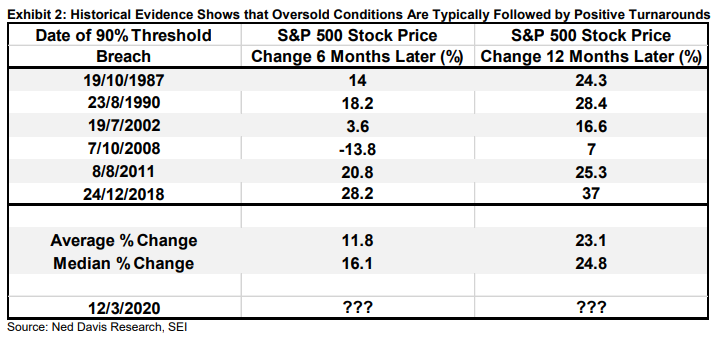
Exhibit 2 shows the historical track record 6 and 12 months after the date when 90% of S&P 500 Index constituents first pierced their respective 200-day moving averages on the way down. This study goes back to the Crash of 1987 and the latest 90% trigger took place on 12 March 2020.
We can see that the S&P 500 Index was positive six months later in every case except the Global Financial Crisis from 2008 to 2009. Looking out 12 months from the 90% threshold, however, shows positive performance in every case.
SEI’s View
While past performance is not a reliable indicator of future results, we think the math contains an important message for investors. All of the available information right now has compelled investors to push stock prices to their cheapest valuations in years (the P/E and P/B ratios for the MSCI ACWI Index are at their lowest levels since 2012, see Exhibit 1).
Furthermore, as the oversold indicator suggests, these types of technical conditions have historically preceded positive turnarounds.
While math and logic don’t always look correct over short time frames, sharp selloffs provide investors with an opportunity to own stocks at inexpensive levels under historical conditions that should inspire confidence. Looking beyond the fear with a critical eye will enable investors to see the opportunity that’s beginning to take shape.
Glossary of Financial Terms
Price-to-Book (P/B) Ratio: The total market capitalisation of a stock or index divided by its book value, where book value is the value of an asset as it appears on a balance sheet, equal to cost minus accumulated depreciation. The value is the same whether the calculation is done for the whole company (or companies) or on a per-share basis.
Price-to-Earnings (P/E) Ratio: The total market capitalisation of a stock or index divided by trailing 12-month after-tax earnings. The higher the P/E ratio, the more the market is willing to pay for each dollar of earnings.
Index Definitions
MSCI ACWI Index: The MSCI ACWI Index is a market-capitalisation-weighted index composed of over 2,000 companies, and is representative of the market structure of 46 developed- and emerging-market countries in North and South America, Europe, Africa and the Pacific Rim. The Index is calculated with net dividends reinvested in US dollars.
S&P 500 Index: The S&P 500 Index is an unmanaged market-capitalisation-weighted index comprising 500 of the largest publicly-traded US companies and is considered representative of the broad US stock market.
Important Information
The opinions and views in this commentary are of SEI only and are subject to change. They should not be construed as investment advice. Investments in SEI Funds are generally medium- to long-term investments. The value of an investment and any income from it can go down as well as up.
Investors may get back less than the original amount invested. Returns may increase or decrease as a result of currency fluctuations. Past performance is not a reliable indicator of future results. Additionally, this investment may not be suitable for everyone. If you should have any doubt whether it is suitable for you, you should obtain expert advice.
The SEI Global Assets Fund Plc, SEI Global Investments Fund Plc, and SEI Global Master Fund Plc (the “SEI Funds”) are structured as open-ended collective investment schemes and are authorised in Ireland by the Central Bank as a UCITS pursuant to the UCITS Regulations. The SEI Funds are managed by SEI Investments, Global Ltd (“SIGL”). SIGL has appointed SEI Investments (Europe) Ltd (“SIEL”), an affiliate of SIGL, (together “SEI”) to provide general distribution services in relation to the SEI Funds either directly or through the appointment of other sub-distributors. The SEI Funds may not be marketed to the general public except in jurisdictions where the funds have been registered by the relevant regulator. The matrix of the SEI fund registrations can be found here seic.com/GlobalFundRegistrations.
No offer of any security is made hereby. Recipients of this information who intend to apply for shares in any SEI Fund are reminded that any such application may be made solely on the basis of the information contained in the Prospectus. This material represents an assessment of the market environment at a specific point in time and is not intended to be a forecast of future events, or a guarantee of future results.
This information should not be relied upon by the reader as research or investment advice regarding the funds or any stock in particular, nor should it be construed as a recommendation to purchase or sell a security, including futures contracts. In addition to the normal risks associated with equity investing, international investments may involve risk of capital loss from unfavourable fluctuation in currency values, from differences in generally accepted accounting principles or from economic or political instability in other nations. Bonds and bond funds are subject to interest rate risk and will decline in value as interest rates rise. High yield bonds involve greater risks of default or downgrade and are more volatile than investment grade securities, due to the speculative nature of their investments. Narrowly focused investments and smaller companies typically exhibit higher volatility. SEI Funds may use derivative instruments such as futures, forwards, options, swaps, contracts for © 2020 SEI 4 differences, credit derivatives, caps, floors and currency forward contracts. These instruments may be used for hedging purposes and/or investment purposes.
While considerable care has been taken to ensure the information contained within this document is accurate and up-to-date, no warranty is given as to the accuracy or completeness of any information and no liability is accepted for any errors or omissions in such information or any action taken on the basis of this information.
This information is issued by SEI Investments (Europe) Limited, 1st Floor, Alphabeta, 14-18 Finsbury Square, London EC2A 1BR which is authorised and regulated by the Financial Conduct Authority. Please refer to our latest Full Prospectus (which includes information in relation to the use of derivatives and the risks associated with the use of derivative instruments), Key Investor Information Documents and latest Annual or Semi-Annual Reports for more information on our funds.
This information can be obtained by contacting your Financial Adviser or using the contact details shown above. SEI sources data directly from FactSet, Lipper, and BlackRock, unless otherwise stated.


