A long, turbulent flight (Long Version)
Economists have been struggling to find the right analogy to describe the future trajectory of growth and inflation. The optimists favor a “soft landing,” while pessimists see a “hard landing.” Others see “no landing” whatsoever. SEI suggests a fourth possibility: a “holding pattern.”
How does this flight end?
Economists have been struggling for the past several months to find the right analogy to describe the future trajectory of growth and inflation. The optimists favor the term “soft landing,” whereby growth in business activity slows just enough to reduce inflation pressures without causing a recession. Pessimists see a “hard landing” ahead as the global economy stumbles into recession due to overly tight central-bank monetary policies. Still others see “no landing” whatsoever—economic growth actually accelerates, along with inflation. SEI suggests a fourth possibility: a “holding pattern” in which the economy moves in circles with no estimated time of arrival. Economic growth slows, but not enough to push inflation back to the 2% target rate that the Federal Reserve (Fed) and other major central banks have set as their goal. Eventually, the plane runs out of gas and a recession develops.
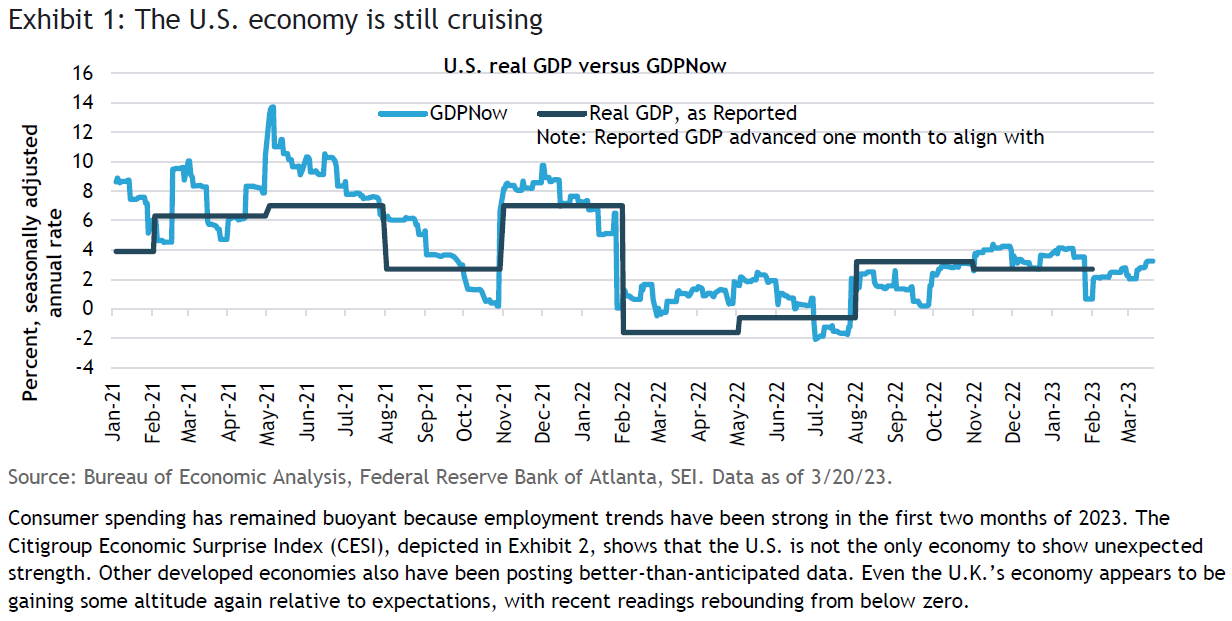
Flight Captain Jerome Powell and his fellow central-bank co-pilots may need to conjure up their inner Chesley “Sully” Sullenberger (the US Airways pilot who successfully landed his Airbus A320 craft in the Hudson River in 2009) to deal with the challenge. Thus far, the American plane remains aloft, although there’s no denying that it currently is flying through some rough weather. The Federal Reserve Bank of Atlanta provides a running estimate of real (inflation-adjusted) gross domestic product (GDP) using a methodology that mimics the official series published by the Bureau of Economic Analysis (BEA). It is not a forecast; the Atlanta Fed merely incorporates data as they are published. The latest reading (as of March 31), seen in Exhibit 1, estimates that first quarter 2023 real GDP is currently running at a 2.5% seasonally adjusted annual rate in the U.S. This is a pace of annualized growth
just a bit slower than the third (+3.2%) and fourth (+2.7%) quarters of 2022. Consumer spending has remained particularly resilient and accounts for most of the advance in overall economic activity for the first quarter of this year. Net exports, non-residential fixed investment (purchases of both nonresidential structures and equipment and software) and government expenditures also have been positive contributors. Conversely, the change in private inventories and residential investment (purchases of private residential structures and residential equipment that are owned by landlords and rented to tenants) are detracting from GDP for the quarter to date.
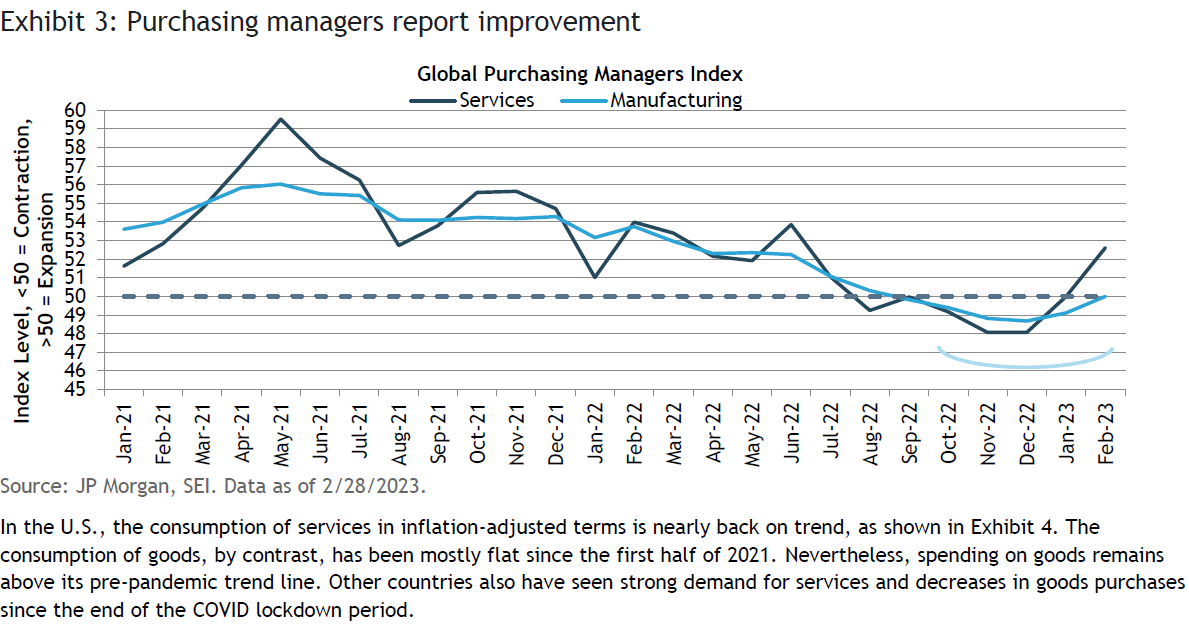
Purchasing managers globally reported a pick-up in both manufacturing and services in February, as highlighted in Exhibit 3. The economic rebound in China appears particularly strong as that country moves out of its zero-COVID lockdown doldrums. Although overall business activity remains sluggish, the resiliency of the global economy in the face of the sharp rise in interest rates prior to mid-March as well as still-elevated inflation pressures has been impressive.
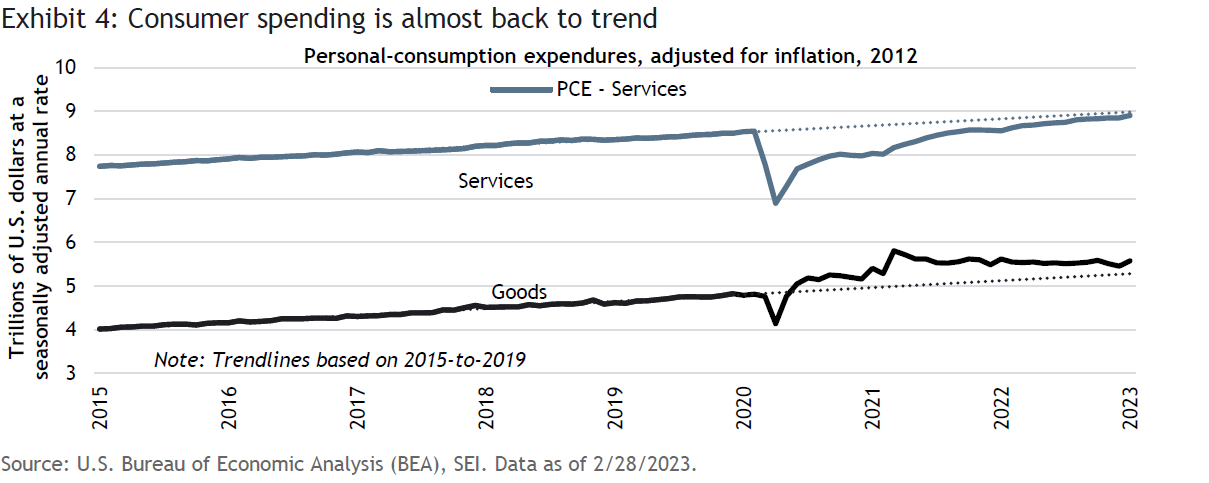
In the U.S., the consumption of services in inflation-adjusted terms is nearly back on trend, as shown in Exhibit 4. The consumption of goods, by contrast, has been mostly flat since the first half of 2021. Nevertheless, spending on goods remains above its pre-pandemic trend line. Other countries also have seen strong demand for services and decreases in goods purchases since the end of the COVID lockdown period.
Unfortunately, the U.S. labor market is tightest in the very sectors (leisure and hospitality, professional and business services, and health care and social assistance services) in which the spending appears to be the strongest. This excess demand is serving to keep inflation at elevated levels for far longer than most economists, central bankers and investors expected. SEI consistently has been predicting that inflation would be higher for longer since the spring of 2021. Our out-of-consensus call was based in part on the tight labor-market conditions that prevailed in the U.S., Canada, the United Kingdom and Europe. Currently reported unemployment rates are at or below long-term equilibrium levels for many countries, implying that labor markets are extremely tight and wage growth is likely to remain higher-than-desired. This topic is of notable interest to us, and we cover it with a more in-depth exploration in our recent paper, “Labor pains.”
Things are starting to break
While the most recent data are still looking good, the U.S. and other major economies are now flying into a storm that was not on anyone’s radar. Over the past several weeks, we witnessed the collapse of three high-profile U.S. financial-institutions–Silvergate Capital, Silicon Valley Bank(SVB), and Signature Bank), a severe and ongoing liquidity squeeze at First Republic Bank, and the takeover of Switzerland-based Credit Suisse (the latter a much larger and systemically important all-service bank and wealth manager) by UBS. Economists and policymakers suddenly are much more concerned that a recession could soon rear its ugly head if the problems in the U.S. and European banking systems lead to a contraction in lending to business and households.
There already has been an upheaval of sorts in the fixed-income market. Bond yields have plunged as investors engage in a massive flight-to-quality despite the still-solid economic data and persistent inflation. The nightmarish memories of the Global Financial Crisis (GFC) of 2007-2009 and the near-paralysis of the banking system at that time might have something to do with investors’ extreme market reaction to recent events.
Rising interest rates and declining liquidity have punished the highest-flying sectors over the past year or two. First came the implosion of the most speculative sectors: meme stocks, cryptocurrencies and Russell 2000 Index (small-cap) companies with no earnings. Then came the upending of the technology and big-name growth stocks that sported very high market valuations. The feverish activity in the residential housing and commercial real estate markets also has taken a big hit as mortgage rates pushed their way up to their highest levels in 15 years. While damaging to investor and household wealth, these reversals thus far have only slowed the gains in economic activity rather than produce an outright recession (although the tech industry, real estate and parts of the finance subsector have been in a painful slump for several months).
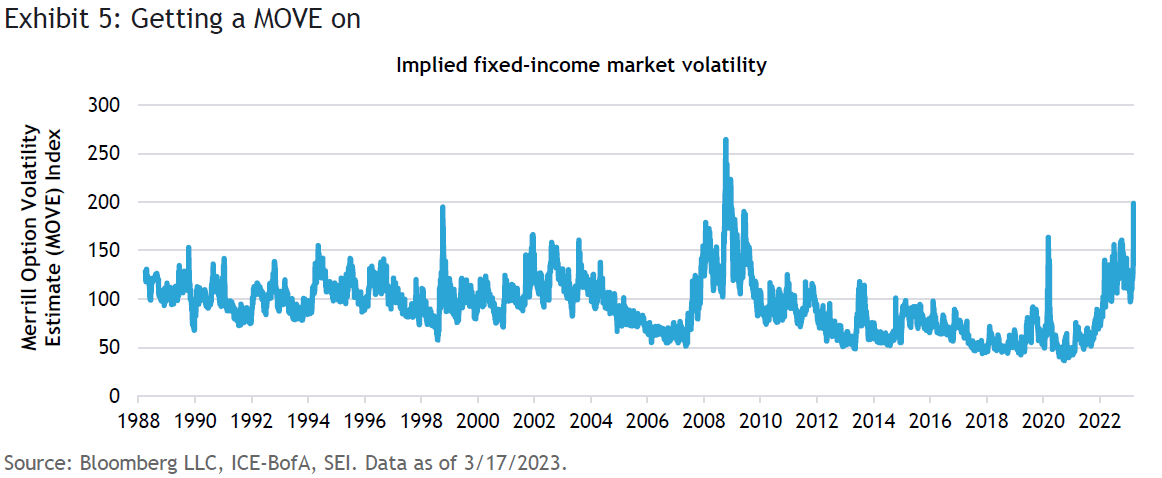
Bond-market volatility has reached new cycle highs in the current financial panic. Exhibit 5 highlights the Merrill Option Volatility Estimate (MOVE) Index, which measures investors’ uncertainty about bond prices and the extent of their risk-aversion. The higher the uncertainty and risk-aversion, the higher the index. In March, this measure hit its highest level since 2008. That degree of bond-market volatility exceeded the March 9, 2020 pandemic-related peak and the historical peak on October 8, 1998, which came on the heels of the collapse of Long Term Capital Management, a large and highly leveraged hedge fund.
We think that this market turmoil and the stress experienced by small- and mid-sized U.S. banks could be the harbinger of economic trouble in the months ahead, although we do not have much evidence of that happening yet. Exhibit 6 indicates that commercial and industrial (C&I) loans in the U.S. have been on the rise since September 2021. The year-over-year gain through February totals 13.2%, more than twice the inflation rate. However, during the GFC, business loans outstanding didn’t decline until October 2008, well after the recession’s official beginning 10 months earlier. It took the Lehman Brothers bankruptcy in mid-September 2008 to cause an abrupt reversal in trend.

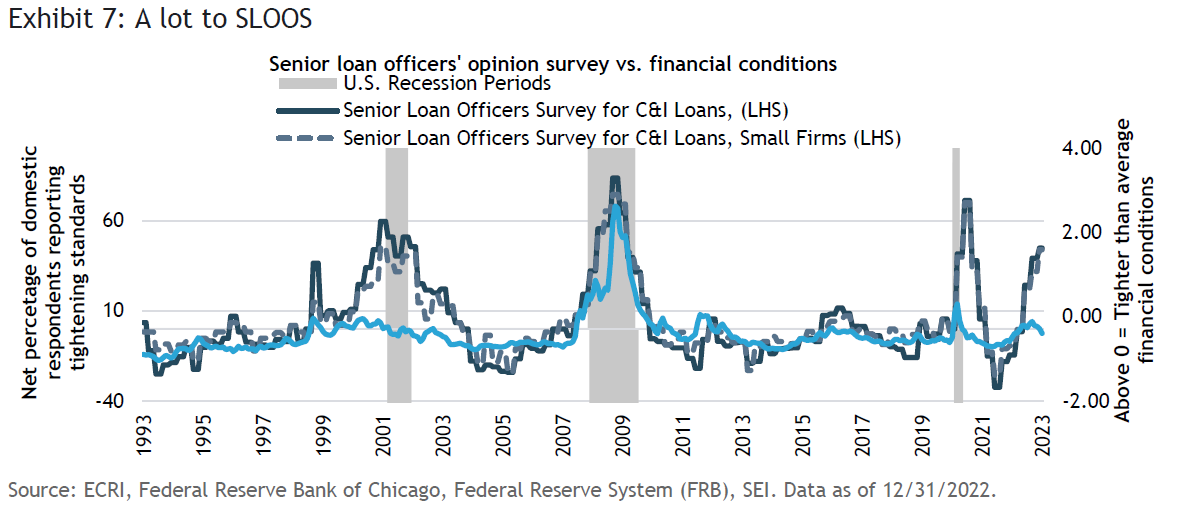
The quarterly Senior Loan Officers Opinion Survey (SLOOS) for commercial and industrial loans and real estate is telegraphing a substantial tightening of standards exceeded only by the extent of stringency recorded in 2020, 2007 to 2008, and 2000 to 2002 (all three periods encompassed U.S recessions). Loan standards most likely will tighten further in the aftermath of the current bank panic, as small-to-medium-sized banks reduce their balance sheets. The latest survey, released in early February and highlighted in Exhibit 7, mostly covers the fourth quarter of 2022 and does not reflect the sudden liquidity crunch now facing an unknown number of banks and other financial institutions.
A matter of confidence
Regulators and central banks globally have been quick to act in the current financial panic; given the various financial “heart attacks” endured over the past 15 years (the GFC, the European periphery debt crisis, and the COVID-19 pandemic), governments understand the need to act fast and with determination.
On the positive side, the drivers behind the current banking crisis are quite different than the ones at the center of the GFC, when the quality of the balance sheets of the largest banks and other financial institutions was the major concern. The stated book value of those assets proved to be much higher than their actual underlying value; indeed, in many cases it was impossible to ascertain the true value of their investments, given the opaqueness and complexity of the investment vehicles.
The current crisis is one of strained financial liquidity resulting from a classic duration mismatch. Small and mid-sized banks have high-quality assets on the books, but their value has been substantially diminished by the sharp rise in interest rates over the past year. SEI believes this is a problem central banks can effectively alleviate via their role as lender of last resort. Of course, a liquidity issue can quickly morph into an insolvency crisis when there is a bank run and depositors demand to withdraw their money, as has occurred at the banks that needed to be rescued. No bank can survive when the money flows out all at once. It is this crisis of depositor confidence that is proving to be hard to defuse, although it appears the worst of the panic has passed.
All five institutions that have needed rescuing suffered from idiosyncratic risks that probably don’t apply to the financial system at large. For example, SVB, Signature Bank, and First Republic Bank suffered old-fashioned bank runs when it became clear that their asset/liability management was not aligned with the riskiness of their uniquely concentrated client base of technology and start-up companies. All of these banks possessed a small depositor base with very large, uninsured balances. Credit Suisse, meanwhile, has been a troubled institution for quite some time, suffering a series of investment-related scandals and poor risk controls despite its status as a global systemically important bank. The Federal Deposit Insurance Corporation (FDIC) has promised to reimburse the uninsured depositors of Silicon Valley Bank and Signature Bank in full, but have not yet extended the same benefit more broadly to other banks that are experiencing severe outflows. This could be the reason why the depositors in First Republic Bank continued to flee. U.S. Treasury Secretary Janet Yellen recently broached the possibility that the federal government might indeed guarantee banks’ uninsured deposits, but then walked it back the very next day. Any such guarantee of uninsured deposits would incur a moral hazard (a greater willingness on the part of banks and investors to take even more risk in the future on the assumption that the government will bail them out and make them whole).
Meanwhile, the Fed and other agencies, such as the Federal Home Loan Bank System, are doing what they must in order to ease the duration mismatch on banks’ balance sheets. The Fed has set up a Bank Term Funding Program (BTFP) similar in nature to those rolled out during the COVID-19 pandemic. Troubled banks can use their Treasury holdings and mortgage-backed securities to secure cash from the Federal Reserve, valuing that collateral at par versus the lower market values the bonds would sell for in the open market. The discount window is also available under similar terms. This alleviates the solvency concerns for many banks owning Treasury and mortgage-backed securities that have lost value as a result of the rise in bond yields.
Unfortunately for First Republic Bank, the bulk of its assets are in high-quality municipal bonds, which is not acceptable as collateral under the terms of the BTFP. This is why a consortium of the largest American banks advanced a $30 billion lifeline to line that can be renewed in six months. The bank has also borrowed more than $100 billon from the Fed’s discount window in order to buy enough time for the panic to fade. As of March 22, commercial banks have increased their borrowings by $570 billion over a two-week period from the Fed’s discount window, the BTFP and other credit facilities on the balance sheet of the U.S. central bank.
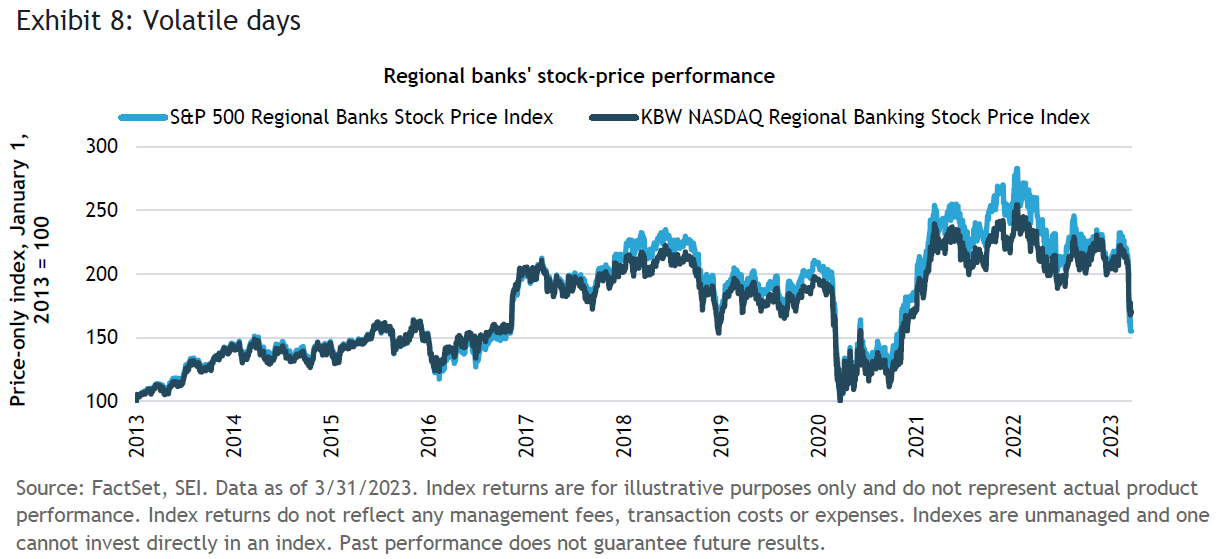
Exhibit 8 tracks two measures of regional bank stock price performance—the S&P 500 Regional Banks Select Industry Index and the KBW NASDAQ Regional Bank Index. Both indexes peaked in early 2022 following a spectacular recovery from their 2020 lows. On the heels of the SVB insolvency, the indexes broke into new cyclical-low territory, last reached in 2020 and 2016. It is obvious that equity investors are still questioning the underlying health of community and regional banks. At this point, it has become a matter of instilling confidence; there is no question that that the Fed, the Department of the Treasury, the FDIC and other regulators here and abroad will continue to do what it takes to stem the panic and liquidity crunch. Depositors simply need to believe that.
The central banks’ dilemma: Fight inflation or support financial stability?
The scariest moment (prior to the past few weeks) came in late September 2022, in the U.K. Bond yields soared when the short-lived government of former Prime Minister Liz Truss unveiled a growth-oriented fiscal policy that would have sharply increased the budget deficit. As U.K. gilt yields rose, the liability-driven investment (LDI) strategies of the country’s pension programs came undone, leading to margin calls and a spiral of forced gilt-selling, causing even higher yields and yet more selling. The dynamic was reminiscent of the October 1987 stock-market crash in the U.S. and the role that portfolio-insurance strategies played at that time.
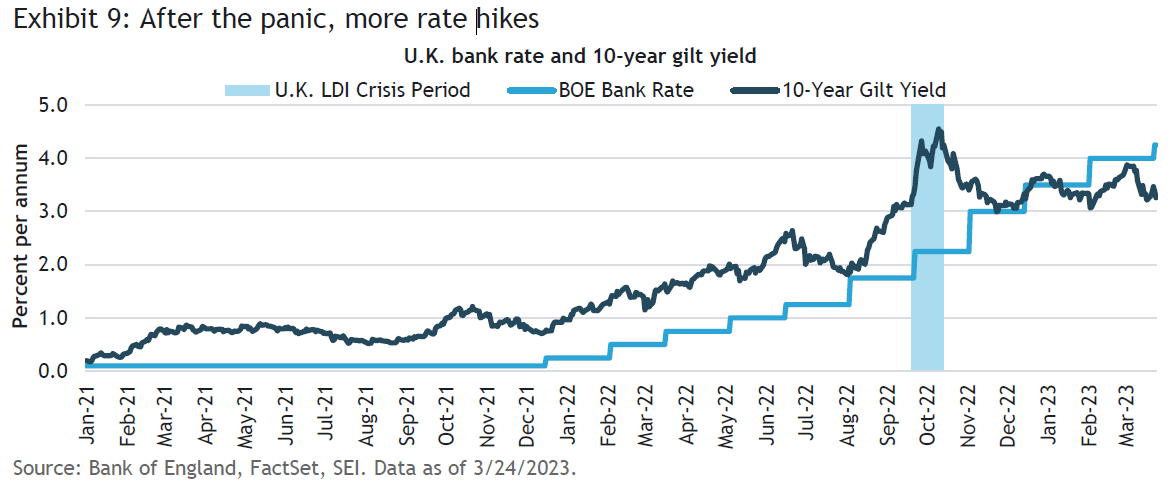
The Bank of England quickly intervened in the crisis and managed to halt the panic before it caused massive damage to the U.K. pension-fund industry or the economy at large. One should note that this episode did not dissuade the Bank of England (BOE) from increasing its policy rate (the Bank Rate) further in the ensuing months, as indicated in Exhibit 9. The BOE raised the Bank Rate another 25 basis points (0.25%) to 4.5% on March 23, in the aftermath of another consumer-price inflation report showing a 10.4% year-over-year gain. Even in the midst of a banking maelstrom BOE Governor Andrew Bailey warned that further policy-rate hikes might be needed.
The current panic episode doesn’t seem to be dissuading other central banks from pursuing their inflation-fighting goals. In particular, the European Central Bank (ECB) surprised the markets by raising its three key policy rates by 0.5%, as members of the Governing Council strongly hinted they would prior to onset of the recent market turbulence. The ECB’s rationale was clear: The mandate is to bring inflation back to its 2% target rate, and the central bank will use its monetary toolset (interest rates and security sales from its balance sheet) in an effort to achieve those goals.
The ECB is not ignoring the financial stability and the underlying health of the banking system, however. Rather, ECB President Christine Lagarde insists there is another set of tools that can be used for that purpose, including liquidity support via its various asset purchase and lending programs, such as the Transmission Protection Instrument (TPI). The TPI was introduced in July 2022, and can be used to counter disorderly market conditions that pose a serious threat to the transmission of monetary policy across the euro area. It gives the central bank the ability to buy the public-sector securities of sovereign and regional governments and agencies with remaining maturities between one and 10 years. There is no preordained limit to the purchases that can be made, and the ECB will have wide discretion regarding which securities to purchase from which member countries.
Meanwhile, the Fed also pushed ahead and raised the federal-funds rate another 0.25%, bringing the policy rate to a range of 4.75% to 5.00%. Prior to the crisis, Fed Chair Jerome Powell had warned that the U.S. central bank might need to step up its tightening efforts due to persistent inflation pressures. The latest projections of the Federal Open Market Committee (FOMC) still call for one more rate hike and no rate reductions until 2024. Participants in the futures markets, however, have priced in a series of cuts before the end of this year, as illustrated in Exhibit 10. In essence, the markets believe that the Fed will blink hard and push the federal-funds rate about one percentage point below what the FOMC is projecting by year-end.
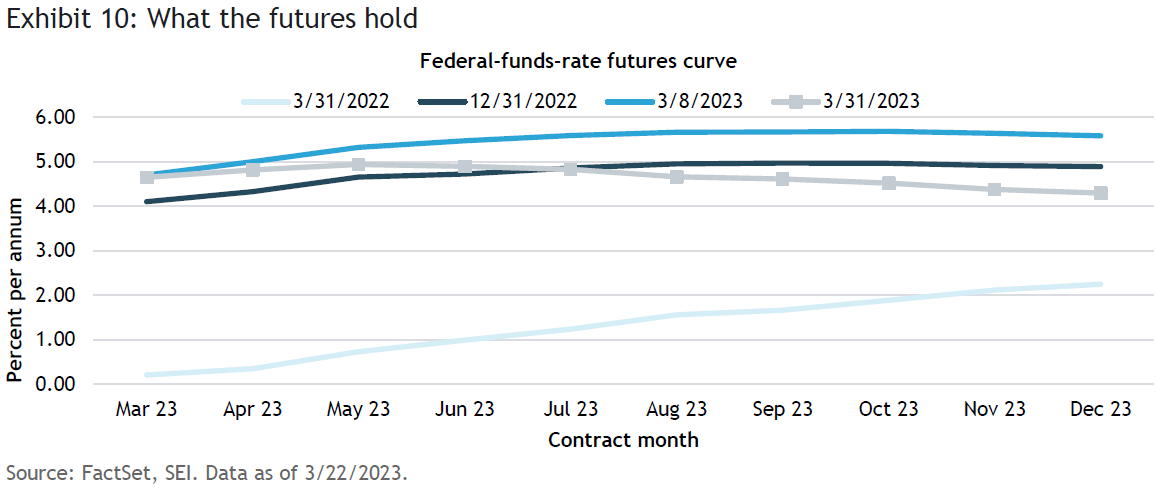
The federal-funds rate futures curve has swung dramatically in just three months, with traders beginning 2023 expecting the central bank to cut interest rates in the second half of the year. When the nonfarm payrolls report for January was released in early February, however, sentiment began to change and those anticipated rates were completely priced out of the futures curve. Before the failure of SVB and the other banks, the entire futures curve had shifted upward in dramatic fashion, with the peak funds rate rising into the 5.50%-to-5.75% area, and the December 2023 contract yielding 5.58%. The fed funds futures curve now has been reset well below where it was at the start of this year.
We understand the market’s willingness to “fight the Fed” now. The tumult in the banking system isn’t over yet; even after this uncertain stage passes, smaller banks will face ongoing pressure to raise deposit rates to more competitive levels, while borrowing from the Fed and U.S. government agencies to improve their liquidity. A recession becomes likelier due to the important role that community and regional banks play in the U.S. financial system. According to the Federal Reserve, smaller banks (below the 25 largest banking institutions ranked by domestic assets), account for some roughly two-thirds of commercial bank loans. They also comprise a very large proportion of credit extended to small businesses.
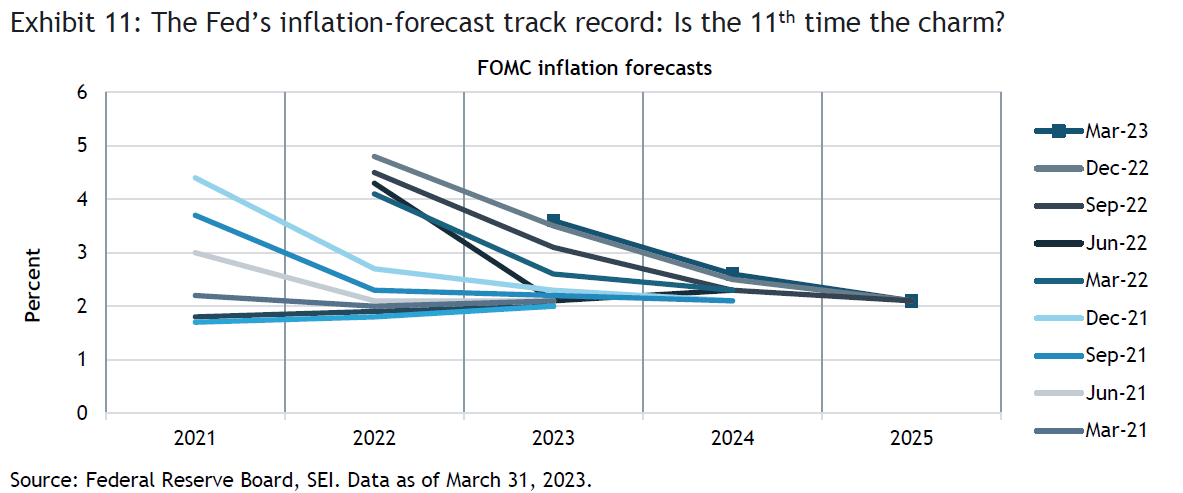
SEI is assuming that the current banking crisis will be quelled by the government’s “whatever-it-takes” attitude. If that belief proves wrong, the Fed could indeed blink and cut rates as the futures curve implies; however, the surge of liquidity being injected into the banking system may well make the job of reducing inflation that much more difficult. As we highlight in Exhibit 11, the FOMC has underestimated the extent and persistence of core PCE inflation for nine consecutive quarters. And, in every quarter since March 2021, the FOMC members have forecast a return to a 2.0% to 2.5% within the next two years. The latest forecast follows the same trajectory, with core PCE inflation falling to 3.6% by December 2023, 2.6% by December 2024, and 2.1% by December 2025. By contrast, PCE core inflation ended 2021 at 4.8% and 2022 at 4.7%.
Federal spending on the rise
While central bankers globally battle inflation, federal government spending continues to rise. Exhibit 12 tracks the progression of U.S. Federal government outlays as a percentage of nominal GDP for the major categories of expenditure. Social Security accounted for just 2.4% of GDP in Fiscal Year (FY) 1962. Twenty years later, it had risen to 4.6% of GDP. The percentage has drifted a bit higher since, but the Congressional Budget Office forecasts a significant increase to 6% by 2033. Medicare and other mandatory spending programs (Medicaid, the Children’s Health Insurance Program, subsidies established under the Affordable Care Act) have grown even faster. It wasn’t even a line item in 1962, but currently equals 5.6% of GDP, and is projected to rise to 6.7% of GDP in 10 years’ time.
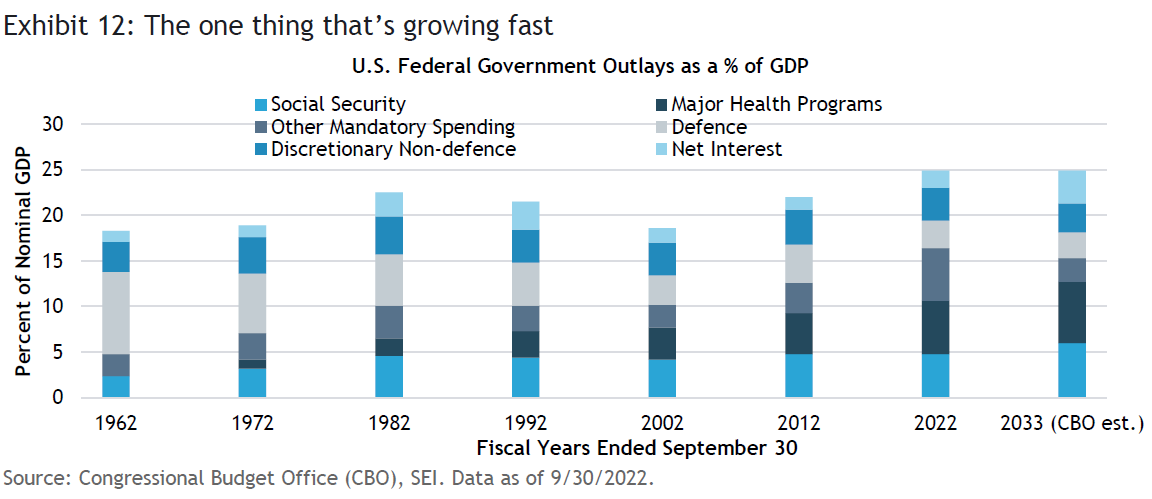
In the absence of substantive reforms, these mandatory spending programs will need to be covered out of general federal government revenue transfers and steep increases in Social Security and Medicare payroll taxes. Draconian cuts in old-age benefits are simply a non-starter, given the political power of the Baby Boomer generation and the devastating economic impact it would have on aggregate demand
And entitlement programs aren’t the only challenge. U.S. government spending reached more than 30% of GDP in 2020 and 2021, turbocharged by emergency COVID payments and depressed economic activity. Nonetheless, even with the expiration of COVID-related spending and the bounce-back in the economy, outlays still amounted to 25% of GDP in the 2022 fiscal year and the Congressional Budget Office (CBO) estimates that expenditures will average 24.1% of GDP between the 2024 and 2033 fiscal years.
That average could be an underestimate: Military expenditures are projected by the CBO to hold steady at or below 3% of GDP, a historically low share. Given the rise in tensions with China over Taiwan and the ongoing conflict in Ukraine, we believe that the share of defense spending will be closer to 4% of GDP, on average, versus the 3% projected average over the 10-year period.
Net interest expense is another category that could be significantly underestimated. The CBO assumes that short-term U.S. Treasury bill rates will fall back to 2.3% by 2026 and stay at that level through 2033. The 10-year Treasury note yield, meanwhile, is forecast to be 3.8% over the projection period. If inflation runs closer to 3% in the longer term rather than the 2% level that the CBO forecasts in 2027 and beyond, we think the net interest expense on the government debt could run at least 0.5 percentage point higher than the 3.1% of GDP that the CBO projects over the period of 2024 to 2033.
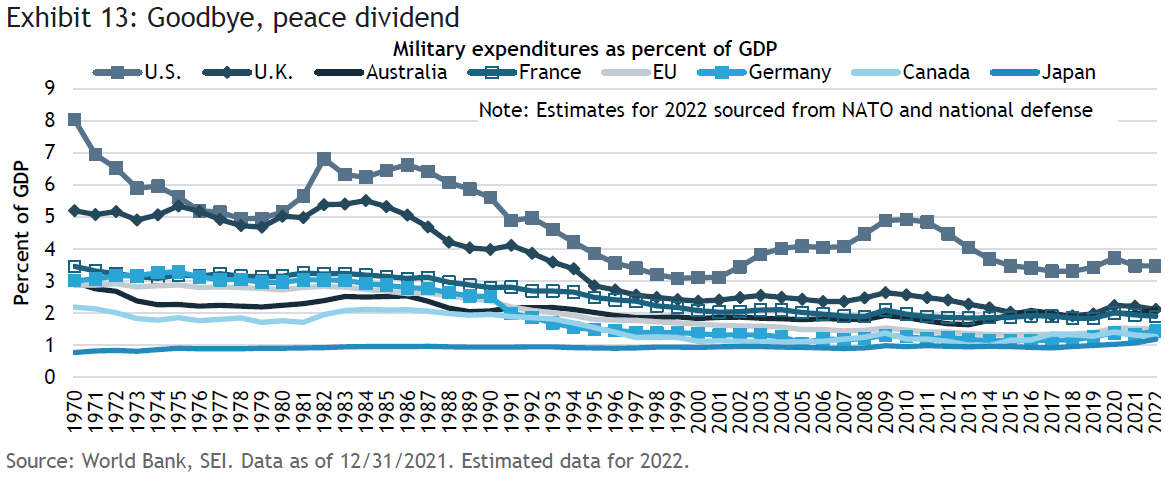
Other countries face similar challenges regarding military spending and rising interest expense against an even worse demographic backdrop. Exhibit 13 tracks military spending as a percentage of nominal GDP for selected countries. The U.S. devotes a substantially larger share of its economic resources to the military than do the other countries in the chart. The U.K., France and Australia spend about 2% of GDP, still near the lowest levels of the past 50 years. The other countries in the exhibit spend even less—only 1.2% (Japan) to 1.4% (Germany). Although defense spending in all of these countries has risen in the past year, only Australia, Germany, and Japan have recorded an increase relative to the growth in their economies.
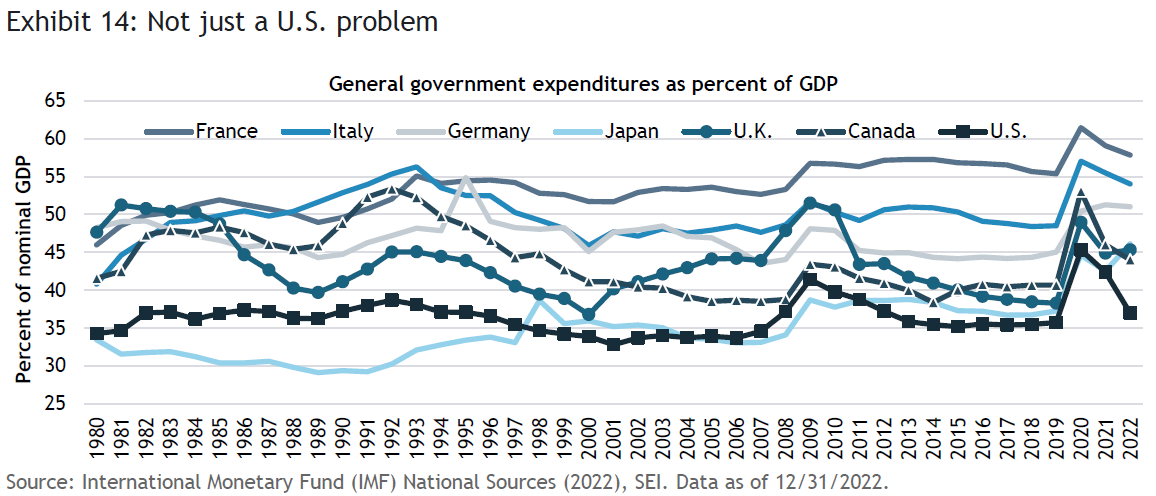
As shown in Exhibit 14, the U.S. is still at the bottom of the list in terms of overall government spending (including state and local outlays) relative to the size its economy. However, the COVID response pushed total expenditures as a percentage of nominal GDP to its highest level since World War II in 2020. The reversion of GDP back to its historical trend levels and the ending of COVID emergency payments reduced spending ratios for the G7 countries in 2021 and 2022. Nonetheless, no country has seen a return of general government spending to pre-pandemic levels. We think that this recent downward trend will reverse in the near future given the aging of “baby boomers,” the need to raise military spending, and the sharp rise in net interest payments.
In the U.K., Chancellor of the Exchequer Jeremy Hunt unveiled the government’s new budget on March 15. It directly addresses the tight employment situation. Among some of the proposals: increasing vocational training; providing tax incentives, enhancing access to capital and easing certain regulations to encourage the creation of new enterprises; and encouraging increased participation in the workforce of individuals with disabilities, welfare recipients, older persons, and parents facing high childcare costs via direct support, tax incentives, and training programs.
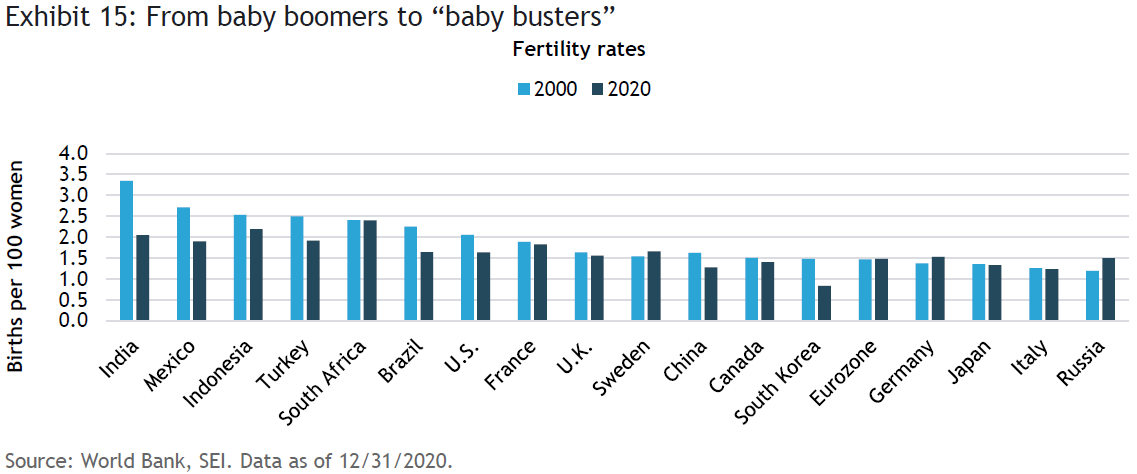
While these steps might be marginally helpful, broad demographic shifts are difficult to bend by government measures once they are set in motion. Exhibit 15 compares the fertility rates across countries for the years 2000 and 2020. Fertility rates have declined in many developing countries (particularly in South Africa), while most developed countries have rates well below the replacement rate of 2.1 live births per 100 women. East Asian countries, including China, have very low fertility rates. South Korea recorded less than one birth per 100 women in 2020, while China’s fertility rate was down to 1.2%. These countries have been trying hard to implement policies to encourage family formation for years without much success. Even Sweden, which has been one of the most generous countries in its provision of childcare support and other incentives, still has a birthrate below the replacement level (although it is slightly higher than 20 years ago).
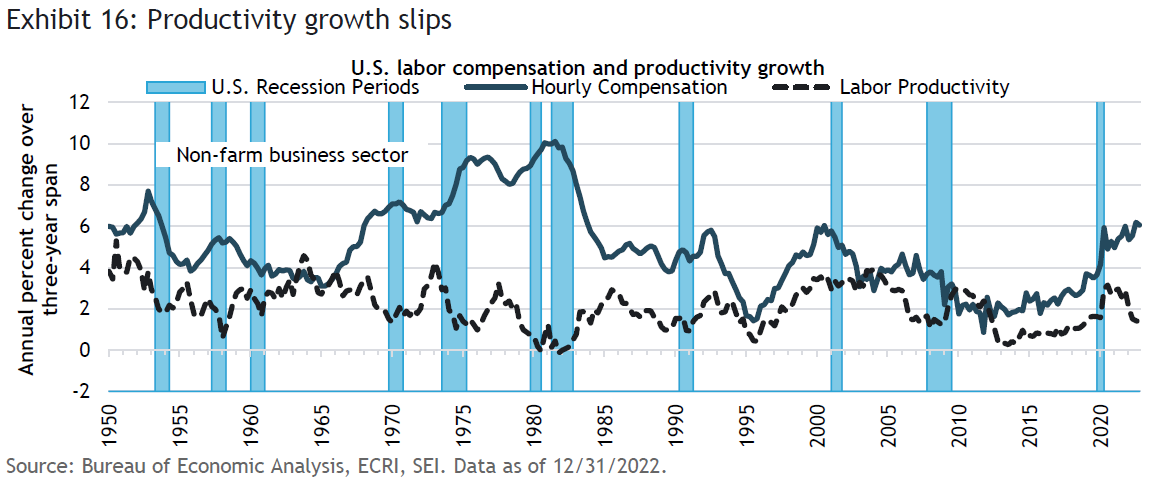
The obvious answer to this secular decline in workers is increased investment in laborsaving equipment and an increase in productivity. It is very likely that, in the years and decades ahead, companies will need to invest heavily in robotics, artificial intelligence and other processes that can make up for the lack of labor. Maybe ChatGPT will prove to be a societal game changer, but that is mere speculation. In the present, productivity in the U.S. and other developed countries has been sagging, not accelerating. Exhibit 16 illustrates the sharp slide in U.S. productivity growth (measured on a three-year annualized basis) in the aftermath of the GFC. There has been another drop-off in the growth rate in recent years following COVID, even as wage costs climbed to their highest levels in more than 20 years.
We think that recent events in the financial markets have raised the odds of recession beginning later this year or in early 2024. As has been the case following previous recessions, wage pressures most likely will ease and inflation should fall as well. However, global financial markets are probably getting ahead of themselves, pricing in near-term cuts in policy rates and a rapid decline in inflation back below 2% within a year. Both cyclical factors (tight labor markets and consumer resiliency especially) and secular factors (a persistently tight labor market, an emphasis on supply chain resiliency over efficiency, higher capital costs, and higher future tax burdens) suggest to us that inflation will remain higher than what central banks and market participants expect. The Fed and other central banks are facing a severe challenge in their attempt to fight inflation while simultaneously ensuring financial stability. If push comes to shove, we expect the central banks to choose financial stability, leaving the inflation fight for another day.
Glossary
A soft landing refers to a moderate economic slowdown following a period of growth.
A hard landing refers to a notable economic slowdown or downturn following a period of rapid growth, usually resulting from a government's attempts to slow inflation.
Gross domestic product (GDP) is the total monetary or market value of all the goods and services produced in a country during a certain period.
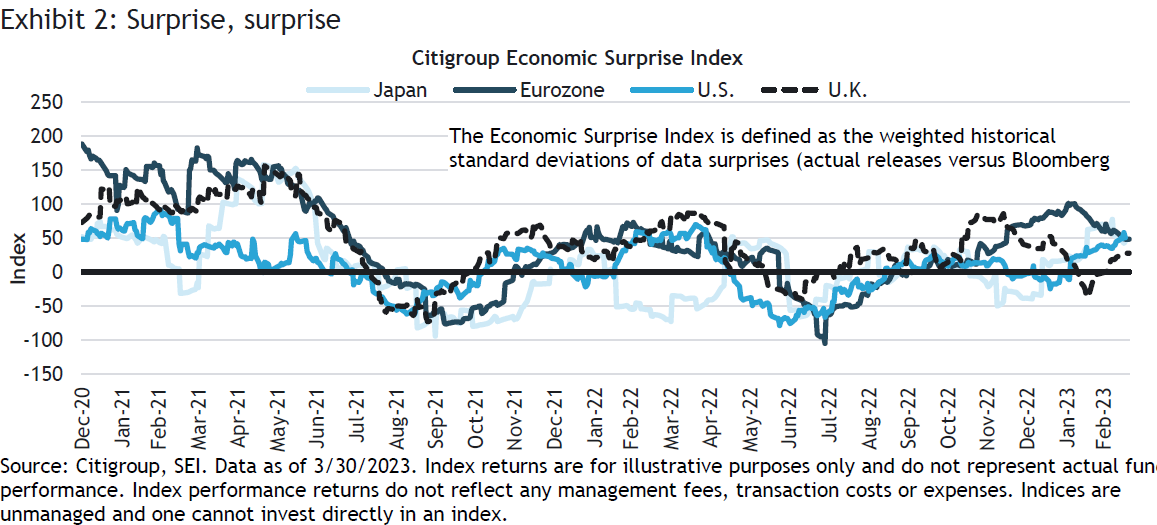
The Citigroup Economic Surprise Index measures the degree to which economic data is beating or missing estimates.
A purchasing managers’ index (PMI) tracks the prevailing direction of economic trends in the manufacturing and service sectors.
The personal-consumption-expenditures (PCE) Price Index measures the prices that consumers pay for goods and services–excluding volatile food and energy prices–to reveal underlying inflation trends.
The Global Financial Crisis (GFC) refers to the period of extreme stress in global financial markets and banking systems between mid-2007 and early 2009.
The U.S. Federal Reserve conducts the Senior Loan Officer Opinion Survey on Bank Lending Practices, obtaining information from up to 80 large domestic banks and 24 U.S. branches and agencies of foreign banks.
Idiosyncratic risk comprises investment risk that is endemic to an individual asset, a group of assets or, in some cases, a specific asset class.
The European periphery debt crisis from 2008-2012, when several European countries experienced the collapse of financial institutions, high government debt, and rapidly rising bond yield spreads in government securities.
Duration is a measure of the sensitivity of the price of a bond or other debt instrument to a change in interest rates. Liability-driven investment (LDI) strategies focus on acquiring sufficient assets to cover all current and future liabilities such as employee pensions.
The federal-funds rate is the interest rate charged to lending institutions on unsecured overnight loans. It is set by the U.S. Federal Reserve’s Federal Open Market Committee. The rate is increased when the Federal Reserve wants to discourage borrowing and slow the economy and decreased when the Federal Reserve wants to spur economic growth.
Federal-funds futures are financial futures contracts based on the federal-funds rate and is traded on the Chicago Mercantile Exchange (CME) operated by CME Group Inc.
The Congressional Budget Office (CBO) provides nonpartisan analysis to the U.S. Congress on federal economic and budgetary matters.
Nominal gross domestic product (GDP) is the total monetary or market value of all the goods and services produced in a country during a certain period, and is not adjusted for inflation.
The G7 is an intergovernmental organization made up of the world's largest developed economies: France, Germany, Italy, Japan, the U.S., the United Kingdom, and Canada.
“Baby boomers” include individuals who were who was born between 1946 and 1964. The baby boomer generation comprises a substantial portion of the world's population, especially in developed nations.
The non-accelerating inflation rate of unemployment (NAIRU) represents the lowest unemployment rate that can be sustained without causing wages growth and inflation to rise.
ChatGPT is a natural language processing tool driven by artificial intelligence (AI) technology that allows a user to have human-like conversations with a chatbot (a computer program that simulates human conversation through voice commands or text chats or both).
Index definitions
The Citigroup Economic Surprise Index measures the degree to which economic data is beating or missing estimates.
A purchasing managers’ index (PMI) tracks the prevailing direction of economic trends in the manufacturing and service sectors.
The personal-consumption-expenditures (PCE) Price Index measures the prices that consumers pay for goods and services–excluding volatile food and energy prices–to reveal underlying inflation trends.
The Russell 2000 Index tracks the performance of the small-cap segment of the U S. equity market. The index is a subset of the Russell 3000 Index, which comprises the 3,000 largest U.S. companies, and includes approximately 2,000 of the smallest securities based on a combination of their market cap and current index membership.
The Merrill Option Volatility Estimate (MOVE) Index, an indicator of investors’ uncertainty and risk-aversion, measures the implied yield volatility of a basket of one-month over-the-counter options on two-, five-, 10-, and 30-year U.S. Treasurys.
The National Financial Conditions Index tracks U.S. financial conditions in money markets, debt and equity markets, and the traditional and "shadow" banking systems (financial institutions that provide similar services to those of banks but are subject to little or no regulatory oversight). Positive values for the index indicate that financial conditions are tighter than average, while negative values indicate financial conditions that are looser than average.
The S&P 500 Regional Banks Select Industry Index measures the performance of U.S. regional bank stocks included in the S&P Total Market Index, which tracks the broad U.S. equity market (large-, mid-, small-, and micro-cap stocks).
The KBW Nasdaq Bank Index tracks the performance of the 24 largest publicly traded U.S. regional banks, national money centers, and thrifts.
Important information
This material represents an assessment of the market environment at a specific point in time and is not intended to be a forecast of future events or a guarantee of future results. Positioning and holdings are subject to change. All information as of the date indicated. There are risks involved with investing, including possible loss of principal. This information should not be relied upon by the reader as research or investment advice, (unless you have otherwise separately entered into a written agreement with SEI for the provision of investment advice) nor should it be construed as a recommendation to purchase or sell a security. The reader should consult with their financial professional for more information.
Statements that are not factual in nature, including opinions, projections and estimates, assume certain economic conditions and industry developments and constitute only current opinions that are subject to change without notice. Nothing herein is intended to be a forecast of future events, or a guarantee of future results.
Certain economic and market information contained herein has been obtained from published sources prepared by other parties, which in certain cases have not been updated through the date hereof. While such sources are believed to be reliable, neither SEI nor its affiliates assumes any responsibility for the accuracy or completeness of such information and such information has not been independently verified by SEI.
There are risks involved with investing, including loss of principal. The value of an investment and any income from it can go down as well as up. Investors may get back less than the original amount invested. Returns may increase or decrease as a result of currency fluctuations. Past performance is not a reliable indicator of future results. Investment may not be suitable for everyone.
This material is not directed to any persons where (by reason of that person's nationality, residence or otherwise) the publication or availability of this material is prohibited. Persons in respect of whom such prohibitions apply must not rely on this information in any respect whatsoever.
The information contained herein is for general and educational information purposes only and is not intended to constitute legal, tax, accounting, securities, research or investment advice regarding the strategies or any security in particular, nor an opinion regarding the appropriateness of any investment. This information should not be construed as a recommendation to purchase or sell a security, derivative or futures contract. You should not act or rely on the information contained herein without obtaining specific legal, tax, accounting and investment advice from an investment professional.
The views contained herein are not to be taken as advice or a recommendation to buy or sell any investment in any jurisdiction. Our outlook contains forward-looking statements that are judgments based upon our current assumptions, beliefs and expectations. If any of the factors underlying our current assumptions, beliefs or expectations change, our statements as to potential future events or outcomes may be incorrect. We undertake no obligation to update our forward-looking statements.
The opinions and views in this commentary are of SIEL only unless stated and are subject to change. They should not be construed as investment advice.
Information issued in the UK by SEI Investments (Europe) Limited, 1st Floor, Alphabeta, 14-18 Finsbury Square, London EC2A 1BR which is authorised and regulated by the Financial Conduct Authority. Investments in SEI Funds are generally medium- to long-term investments.
This information is being made available in Hong Kong by SEIAL. The contents of this document have not been reviewed by any regulatory authority in Hong Kong. You are advised to exercise caution in relation to the offer. If you are in any doubt about any of the contents of this document, you should obtain independent professional advice.
This information is made available in Latin America and the Middle East FOR PROFESSIONAL (non-retail) USE ONLY by SIEL.
Any questions you may have in relation to its contents should solely be directed to your Distributor. If you do not know who your Distributor is, then you cannot rely on any part of this document in any respect whatsoever.
SIEL is not licensed under Israel’s Regulation of Investment Advising, Investment Marketing and Portfolio Management Law, 5755-1995 (the “Advice Law”) and does not carry insurance pursuant to the Advice Law. No action has been or will be taken in Israel that would permit a public offering or distribution of the SEI Funds mentioned in this email to the public in Israel. This email and any of the SEI Funds mentioned herein have not been approved by the Israeli Securities Authority (the “ISA”).
Issued in South Africa by SEI Investments (South Africa) (Pty) Limited FSP No. 13186 which is a financial services provider authorised and regulated by the Financial Sector Conduct Authority (FSCA). Registered office: 3 Melrose Boulevard, 1st Floor, Melrose Arch 2196, Johannesburg, South Africa.
This material is intended for information purposes only and the information in it does not constitute financial advice as contemplated in terms of the Financial Advisory and Intermediary Services Act.


