High yield remains resilient despite recent volatility.
It has been an eventful start to 2025, with tariffs, inflation, and the prospect of a recession all hot button topics. On April 2, President Trump’s Liberation Day, new tariffs were announced to address what the administration considered to be unfair trade practices.
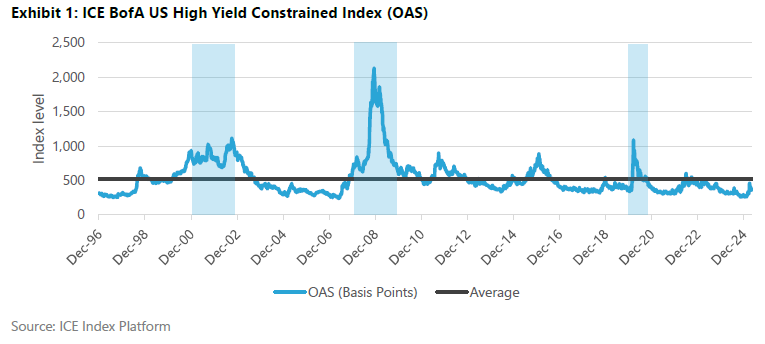
Prior to the announcement, the option adjusted spread (OAS), of the high yield market (as measured by the ICE BofA US High Yield Constrained Index) was 342 basis points while the year-to-date low was 259 basis points on January 22.
Following the announcement, financial markets sold off dramatically and high yield spreads widened notably, peaking at 461 basis points on April 7 which was the highest level since June 2023. On April 9, there was an announcement of a 90-day suspension of additional tariffs which offered relief to the markets evidenced by OAS tightening over the course of the next month ending at 316 basis points on May 16.
While the size of the move was eye catching, the nearly thirty-year average high yield spread is roughly 525 basis points, so the market was below that threshold at the April 7 peak and well below it at the time of this writing (mid-May). The recent spread widening, which was the most extreme of the past two years, doesn’t compare to recent stressful periods of 2001-02, 2008-09, and 2020 in which the high yield market OAS exceeded 1,000 basis points as displayed in Exhibit 1 below.
The high yield market’s yield-to-worst (YTW), which represents the lowest possible yield excluding a default scenario, followed a similar path. Peaking at 8.65% on April 7, the market yield is now less than 8% whereas the long-term average is approximately 8.4%.
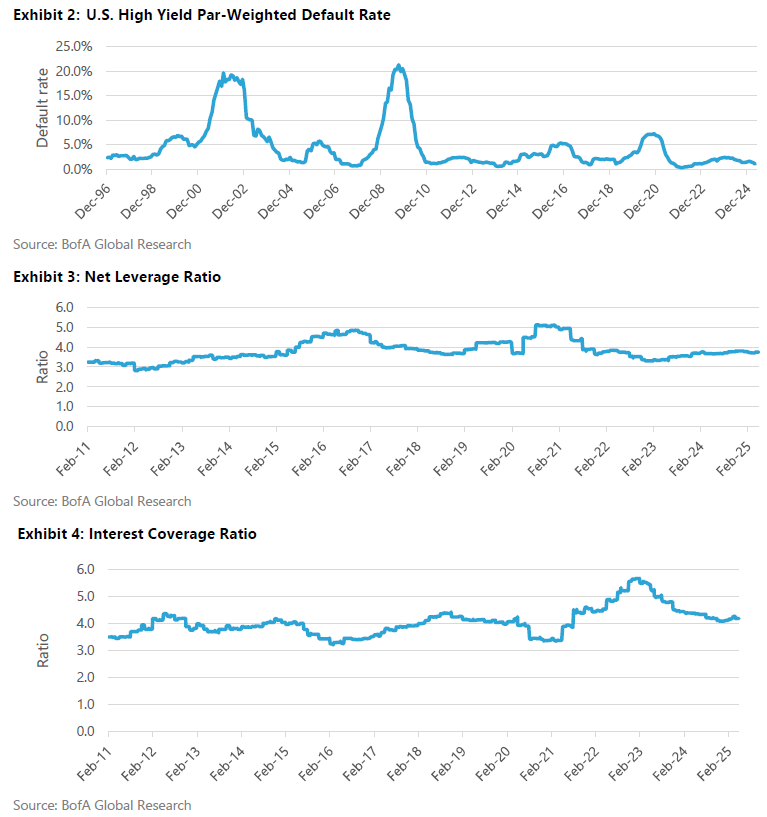
As the high yield spread approached its pre-Liberation Day level, corporate fundamentals remained healthy as evidenced by low default rates and reasonable net leverage and interest coverage (shown in Exhibits 2 through 4). While these are historical statistics, the high yield market is not currently pricing a deterioration in corporate fundamentals and that has been supported by the previously mentioned OAS level. Historically, OAS levels surpassing 600 basis points would be an early signal of market distress or the possibility of recession.
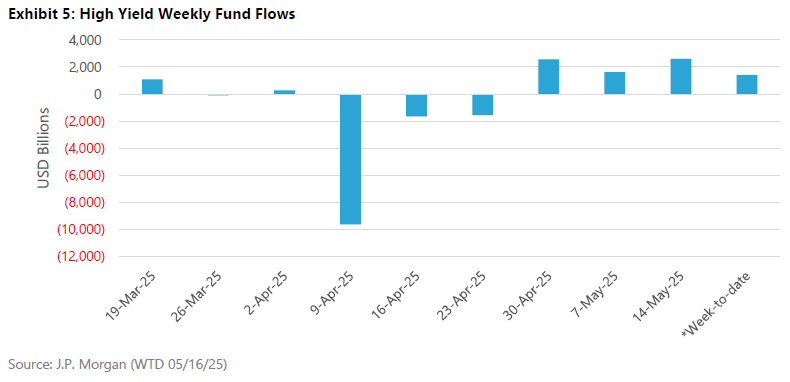
Another gauge for general market health is fund flow data which is a reading of inflows and outflows (shareholder/investor activity) for the respective asset class. This includes, but isn’t limited to, mutual funds and exchange-traded funds (ETFs). In the case of the high yield market, inflows are generally a sign of strength and confidence in the asset class, whereas outflows can be a sign of concern. As the high yield market spread widened, investors redeemed from high yield mutual funds (see Exhibit 5) in April as nearly $13 billion left the asset class.
However, as spreads began to tighten, the high yield market experienced three consecutive weeks of inflows in excess of $6 billion. We wouldn’t be surprised to see inflows continue into the asset class should OAS remain near their current level or if they tighten further.
Volatile markets can be favorable for active management as they offer attractive buying opportunities and skilled managers may avoid credit mistakes. Active management can prove beneficial as managers are not required to buy the entire market unlike the passive alternative. Recently, managers added some risk in high conviction positions, but positions were relatively small. Should recessionary fears come to the forefront, then OAS would most likely exceed 600 basis points, providing active managers with additional attractive opportunities.
Important information
This material represents an assessment of the market environment at a specific point in time and is not intended to be a forecast of future events or a guarantee of future results. Positioning and holdings are subject to change. All information as of the date indicated. There are risks involved with investing, including possible loss of principal. This information should not be relied upon by the reader as research or investment advice, unless you have otherwise separately entered into a written agreement with SEI for the provision of investment advice) nor should it be construed as a recommendation to purchase or sell a security. The reader should consult with their financial professional for more information.
Statements that are not factual in nature, including opinions, projections and estimates, assume certain economic conditions and industry developments and constitute only current opinions that are subject to change without notice. Nothing herein is intended to be a forecast of future events, or a guarantee of future results.
Certain economic and market information contained herein has been obtained from published sources prepared by other parties, which in certain cases have not been updated through the date hereof. While such sources are believed to be reliable, neither SEI nor its affiliates assumes any responsibility for the accuracy or completeness of such information and such information has not been independently verified by SEI.
There are risks involved with investing, including loss of principal. The value of an investment and any income from it can go down as well as up. Investors may get back less than the original amount invested. Returns may increase or decrease as a result of currency fluctuations. Past performance is not a reliable indicator of future results. Investment may not be suitable for everyone.
Index returns are for illustrative purposes only and do not represent actual investment performance. Index performance returns do not reflect any management fees, transaction costs or expenses. Indexes are unmanaged, and one cannot invest directly in an index. Past performance does not guarantee future results.
This material is not directed to any persons where (by reason of that person's nationality, residence or otherwise) the publication or availability of this material is prohibited. Persons in respect of whom such prohibitions apply must not rely on this information in any respect whatsoever.
The information contained herein is for general and educational information purposes only and is not intended to constitute legal, tax, accounting, securities, research or investment advice regarding the strategies or any security in particular, nor an opinion regarding the appropriateness of any investment. This information should not be construed as a recommendation to purchase or sell a security, derivative or futures contract. You should not act or rely on the information contained herein without obtaining specific legal, tax, accounting and investment advice from an investment professional.
The views contained herein are not to be taken as advice or a recommendation to buy or sell any investment in any jurisdiction. Our outlook contains forward-looking statements that are judgments based upon our current assumptions, beliefs, and expectations. If any of the factors underlying our current assumptions, beliefs or expectations change, our statements as to potential future events or outcomes may be incorrect. We undertake no obligation to update our forward-looking statements.
Information in the U.S. is provided by SEI Investments Management Corporation (SIMC), a wholly owned subsidiary of SEI Investments Company (SEI).
Information provided in Canada by SEI Investments Canada Company, the Manager of the SEI Funds in Canada.
In the UK and the EEA this information issued in the UK by SEI Investments (Europe) Ltd, 1st Floor, Alphabeta, 14-18 Finsbury Square, London EC2A 1BR which is authorised and regulated by the Financial Conduct Authority. Investments in SEI Funds are generally medium- to long-term investments.
The contents of this document have not been reviewed by any regulatory authority in Hong Kong. You are advised to exercise caution in relation to the offer. If you are in any doubt about any of the contents of this document, you should obtain independent professional advice.
This document has not been registered as a prospectus with the Monetary Authority of Singapore.
This information is made available in Latin America, the Middle East and Australia FOR PROFESSIONAL (non-retail) USE ONLY by SIEL.
Any questions you may have in relation to its contents should solely be directed to your Distributor. If you do not know who your Distributor is, then you cannot rely on any part of this document in any respect whatsoever.
SIEL is not licensed under Israel’s Regulation of Investment Advising, Investment Marketing and Portfolio Management Law, 5755-1995 (the “Advice Law”) and does not carry insurance pursuant to the Advice Law. No action has been or will be taken in Israel that would permit a public offering or distribution of the SEI Funds mentioned in this email to the public in Israel. This email and any of the SEI Funds mentioned herein have not been approved by the Israeli Securities Authority (the “ISA”).
Issued in South Africa by SEI Investments (South Africa) (Pty) Limited FSP No. 13186 which is a financial services provider authorised and regulated by the Financial Sector Conduct Authority (FSCA). Registered office: 3 Melrose Boulevard, 1st Floor, Melrose Arch 2196, Johannesburg, South Africa.


