A Healthier World, but a Sicker Bond Market (Long Version)
The war against COVID-19 is not over, but the path to victory has become clearer as more vaccines are being produced and distributed. Accordingly, investors appear to anticipate a return to a more normal world. This is reflected in the rapid rise in bond yields—which has been the most important change in the financial environment so far this year. This jump in yields has caused outsized price drops in long-term fixed-income securities (bond yields and prices move inversely) which has helped fuel a sharp equity-market rotation away from expensive growth stocks and into value-oriented and cyclical sectors around the world.
This widespread rise in yields should not come as a complete shock. At the start of 2021, most economists and bond investors expected rising bond yields. Few, however, predicted the speed or extent of the increases. While US sovereign debt set the pace, yields have been rising in other countries too, as Exhibit 1 illustrates.
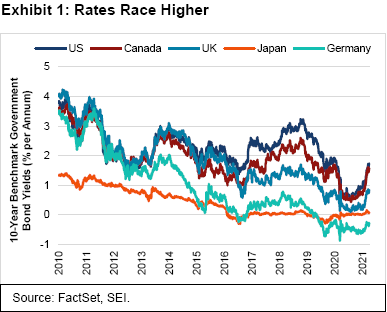
Since the start of the year, the 10-year US Treasury bond climbed from 0.92% to 1.74%, translating into a total-return decline of 7.0% as at 31 March 2021. Measured from just over a year ago, when the 10-year US Treasury yield hit a record low of 0.5% on 9 March 2020, the total-return decline amounts to 9.8%. Longer-term issues suffered greater damage, with the 30-year US Treasury bond down by a whopping 27.8% in total-return terms through 31 March 2021.
A longer-term perspective
Taking a historical total-return perspective, the structural bull market (which begins off of a bear market low and continues until a valuation peak is reached) in 10- and 30-year benchmark US Treasury bonds has been in place for nearly four decades. Exhibit 2 highlights their respective performance from 2000 to the present.
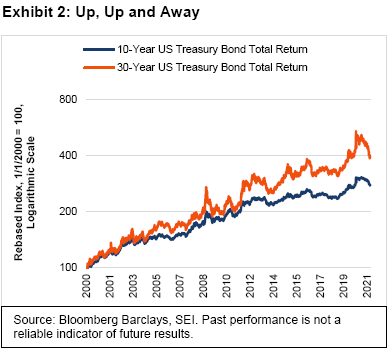
Over this 20-year-plus timeframe, the 10-year bond provided a cumulative return of nearly 200%; the 30-year bond had a total-return gain of 300%. Along the way, however, there have been some major corrections—and the pullback over the past year ranks as one of the sharpest. Of course, the most recent cyclical bull market, which lasted from November 2018 until its peak on 9 March 2020, was unusually strong versus those of previous cycles.
SEI’s fixed-income portfolio managers expect the bond market to stabilise now that higher yield levels have been achieved. This should alleviate some of the selling pressure that technology and other high-priced growth stocks have endured in recent months. Our portfolio managers believe that a new trading range between 1.25% and 1.75% on the 10-year US Treasury bond has been established, although expectations appear to favour the possibility of yields surpassing that and moving toward 2% as the economy gathers additional strength later in the year.
Fixed-income markets certainly face continuing challenges. Even after the boost in nominal US Treasury yields, they remain near the bottom end of the range that has prevailed during the past 10 years, as seen in Exhibit 3. We took this chart all the way back to 1960; because measures of market-derived inflation expectations before 2003 are not available, we derived the inflation-adjusted bond rate by subtracting the year-to-year change in consumer prices (as measured by the US Department of Labour’s consumer-price index, or CPI) from the nominal bond yield. Real rates (that is, the nominal bond yield minus the inflation rate) remain in negative territory.
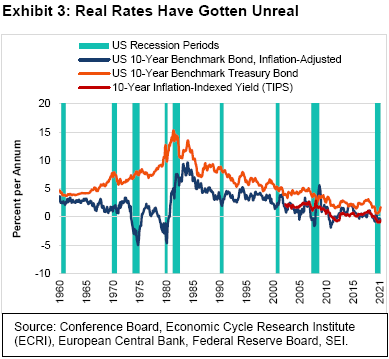
Although more volatile, this rough-and-ready approximation of the inflation-adjusted return still makes the point that negative yields are a rare development—occurring mainly during the highly inflationary period of the late 1970s, a time when the CPI often surprised to the upside. Even if inflation expectations stabilise around the current 2.3%, as implied by the US Treasury inflation-protected securities (TIPS) market, it’s still possible for nominal rates to move higher as real rates climb in response to the accelerated economic growth and surge in government borrowing that are likely to occur over the next year or so.
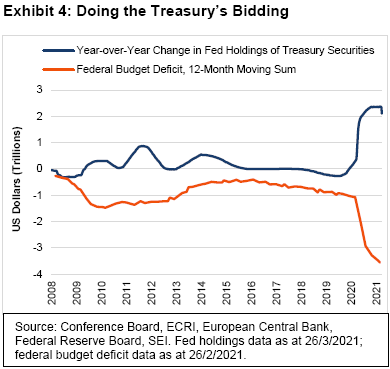
With the third and latest COVID-19 relief package totalling $1.9 trillion, the cumulative amount of fiscal support approved over the past 12 months amounts to a remarkable $6 trillion—a sum that approaches 30% of gross domestic product (GDP). To protect the bond market from the rising tide of US Treasury issuance, the Federal Reserve (Fed) has gone to great lengths in purchasing outstanding issues in recent years. Exhibit 4 shows that the Fed bought $2.1 trillion of Treasury securities in the 12 months ended 26 March 2021; just one month prior, the federal deficit over a 12-month period amounted to $3.55 trillion.
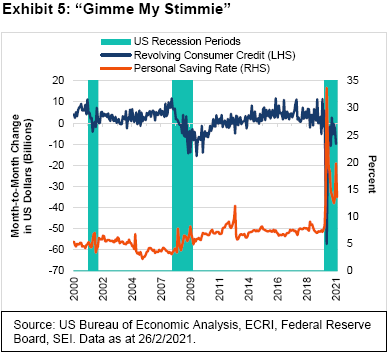
Not all of the money in the $1.9 trillion package will be released at once. The Congressional Budget Office estimates that $1.2 trillion of direct-spending outlays and tax breaks will take place during the fiscal year ended 30 September, and that an additional $500 billion of the stimulus money will be released over the course of fiscal year 2022. Rather than being spent on goods and services, some of that money will be saved.
Exhibit 5 highlights how the first two COVID-19 stimulus packages pushed up the personal-saving rate to extraordinarily high levels over the past year. As of February, saving as a percentage of after-tax income was still a high 13.6%. The saving rate for March will almost certainly be reported as another jump, reflecting the latest distribution of rebate checks. As households hunkered down last year amid the government-mandated lockdowns, they dramatically reduced their credit-card debt balances and added a precautionary cushion to their saving accounts.
Inflation rising, too?
That said, there’s no denying that US households now possess a tremendous amount of firepower that can be spent on goods and services as the economy reopens more fully. Economists have been pushing up their estimates of real GDP growth. In the Federal Open Market Committee’s (FOMC) latest set of economic projections released on 16 March, it forecast a 6.5% gain in real GDP this year (revised sharply upward from a projection of 4.2% made in December) followed by a solid 3.3% advance in 2022. We think the odds favour a further upward revision. The FOMC also provided a higher projection for the core inflation rate this year, to 2.2% versus its previous estimate of 1.8%. Fed Chairman Jerome Powell has gone out of his way to downplay this shift in expectations, insisting that actual outcomes—not forecasted outcomes—will drive monetary policy.
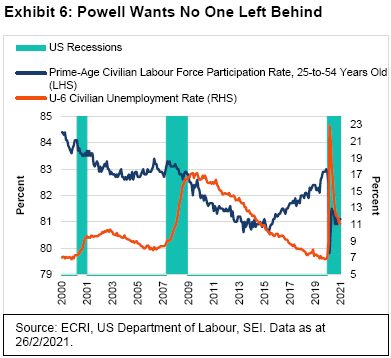
Chairman Powell and the other dovish members of the Fed point to various measures of labour slack, including the U-6 unemployment rate (which takes into account people who have stopped looking for a job and are no longer counted in the headline jobless rate) and the prime-age labour force participation rate. These statistics are found in Exhibit 6.
The Fed’s prioritising of full employment over its inflation mandate also dovetails with the change implemented last year in policy framework to average-inflation targeting. Powell not only dismisses the danger that inflation could become a problem in the future (he’s confident that the Fed has the tools to prevent that from happening) but actually welcomes the prospect of an inflation rate that runs above the central bank’s 2% target for an unspecified period (perhaps a year or more). We believe he will get his wish in the near term, when year-over-year comparisons take into account the lockdown-influenced price declines of last spring.
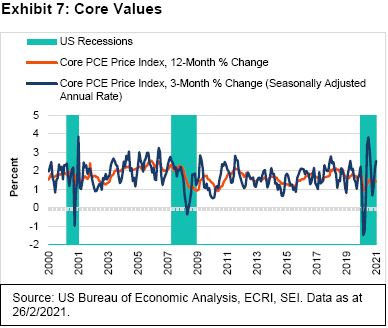
Exhibit 7 on the next page focuses on the 12-month and 3-month (annualised) changes in US personal-consumption expenditures (PCE) price index, the Fed’s preferred measure of inflation. We excluded the volatile food and energy components in order to better assess underlying price trends. When measured on a year-over-year basis, inflation still looked dormant through February. However, the year-over-year readings over the next few months should begin to look considerably stronger, perhaps reaching 2.6% with the data for April and May. Headline PCE inflation (which includes food and energy) should be even higher given the dramatic rebound in energy prices off their 2020 lows.
The 12-month change in the PCE core inflation rate should ease as the weakest year-ago results fall out of the calculations. In the three months ended January, core inflation (which excludes food and energy) ran at an annualised 2.2%. Although more volatile than the year-over-year change, a persistent trend above 2% in the three-month pace will be an important signal for investors that inflation pressures are alive and well.
SEI’s fixed-income managers are taking steps to mitigate the effect of an accelerating inflation rate and additional upward pressure on bond yields.
Generally speaking, markets appear to have priced in the Fed’s basic inflation scenario of a higher cyclical inflation rate above the official 2% target over the next five years, but a lower inflation rate at or below target in the longer run. Investors expect demographics, technological disruption and globalisation—the forces that have kept inflation low in recent decades—to continue to dominate.
Higher bond yields may cause bouts of indigestion in the stock market, but we do not think they will derail the bull market. Rather, we expect to see cyclical and value-oriented stocks continue to advance relative to growth and defensively oriented sectors of the market.
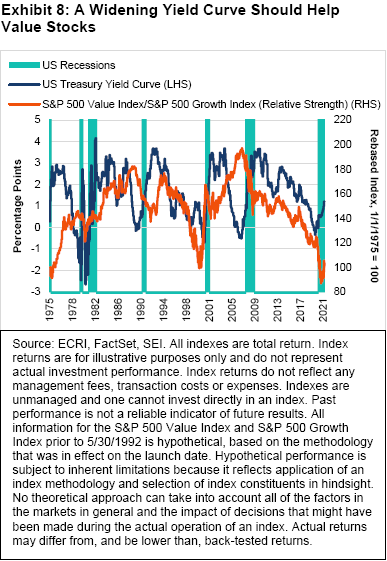
Exhibit 8 tracks the relative performance of the S&P 500 value stocks versus their growth counterparts and compares that relative performance versus the change in the difference between long-term and short-term US Treasury securities (referred to as the yield curve spread). In most cycles, value stocks outperform growth stocks when the yield curve is rising or is exceptionally wide (rates on long-term Treasury bonds are well above those of their short-term counterparts). The relationship broke down in the run-up to the financial crisis; the return to an exceptionally wide spread in the aftermath of that crisis didn’t help value stocks either. During the spring and early summer of 2020, the shift to technology and work-at-home stocks amid the pandemic overwhelmed the normally positive impact of a rising yield curve. However, value has been rebounding since its performance against growth bottomed on the first of September. Only time will tell whether the period of value and cyclical outperformance versus growth can extend for several years, an experience that would mimic that of the 1980s and early 2000s.
The US becomes a laggard
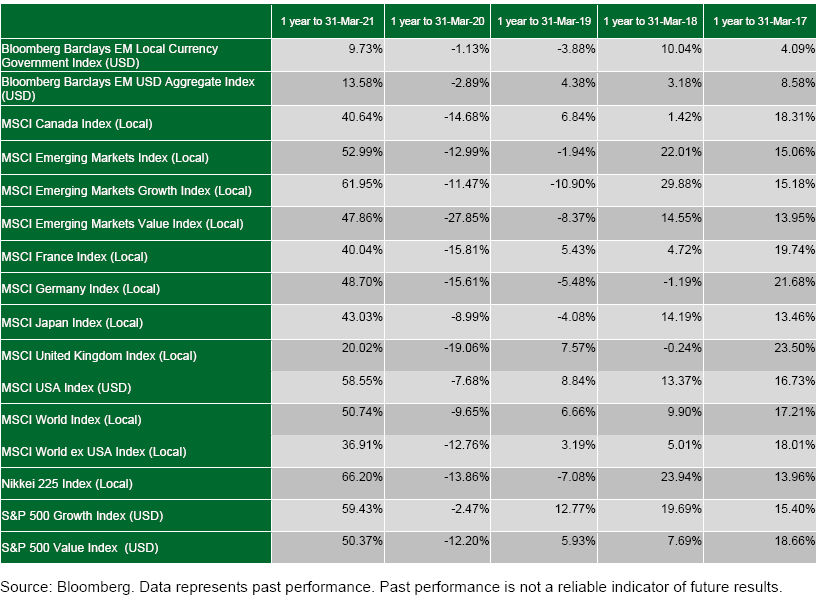
While value-oriented stocks make a comeback against growth in the US, other countries’ equity markets are making a comeback against the US. Exhibit 9 on the following page compares the total returns of the MSCI USA Index, the MSCI World ex USA Index, and the five largest country indexes within the MSCI World ex USA. From the beginning of 2020 to the end of August, the MSCI USA Index massively outgained the other indexes represented in the chart. However, since last September, concurrent with the turnaround in relative performance of the US value stocks cited above, other developed-country stock markets have enjoyed a sharp improvement in unhedged, local-currency terms.
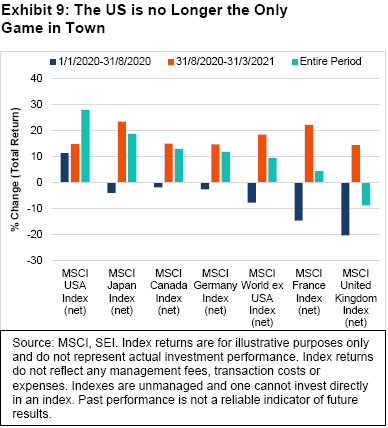
Japan has been the best performer among countries with the highest market capitalisations, gaining 23.54% since the end of August. Its economy has benefited from strong exports to China and the US over the past year. The country’s real GDP at the end of 2020 was only 1.3% below the year-ago level, which was better than most other developed countries (including the US). The Bank of Japan’s decision to maintain its yield-curve-control policy also has been a factor buoying the stock market. The popular Nikkei stock price index has vaulted to levels last seen in the early 1990s. Japan’s longstanding economic problems of debt, deflation and demographic decline have not gone away; they’ve only been pushed into the background by a comparatively mild COVID-19 experience and a decent economic performance over the past year.
France also has seen its stock market gain more than 20% since August. This might be an even greater surprise than the run-up in Japanese share prices. Like much of Europe, the country has been struggling acutely with COVID-19; although, until recently, its government resisted instituting mobility restraints to the same degree as those implemented in other European countries.
Although the UK has significantly lagged the MSCI World Index over the past seven months, its 14.53% total return is only slightly ahead that of the US. Considering all the uncertainty surrounding Brexit and the lockdowns associated with COVID-19 in recent months, this is not a bad outcome. The gyrations in overall UK economic activity through the year may be similar to many other countries, but their magnitude has tended to be greater. More recently, lockdowns caused monthly GDP to decline almost 3% from December to January. The weakness at the start of the year was exacerbated by a steep 41% decline in exports to the EU. Although COVID-19 lockdowns and Brexit-related shipping delays played a role in the exports drop, another big factor was the unwinding of precautionary inventory stockpiles (both exports and imports surged ahead of the Brexit deadline late last year). Goods exports to non-EU countries actually increased in January, continuing a steady upward progression from their May 2020 trough.
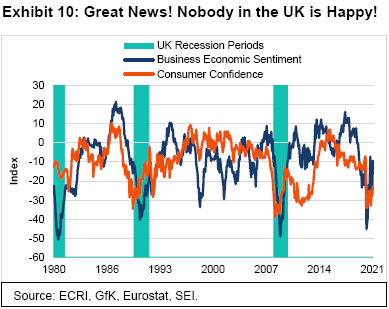
UK business sentiment has risen sharply off its lows this year, but consumer sentiment remains rather depressed, as shown in Exhibit 10. With spring’s arrival and the easing of lockdowns on the back of the country’s successful vaccination effort, we look for the UK to experience a strong recovery in consumer demand and business activity. That recovery may not match the stimulus-fuelled one that the US is set to enjoy, but should nonetheless be more robust than elsewhere in Europe. Consumer and business sentiment tend to be weakest at the bottom of an economic cycle, so we believe the current gloom should be viewed in a positive light. Sentiment should also improve (in London, at least) now that the UK and EU have finally agreed on the way forward to establish rules that will grant additional market access rights for banks and other financial institutions.
UK government policy remains supportive in the near-term. But the recently proposed fiscal budget, which adds only about 3% of GDP to the budget deficit for the 2021-to-2022 fiscal year, appears rather restrained compared to the measures taken by US President Joe Biden’s administration. From the 2023-to-2024 fiscal year, policy actions will begin to reduce the US deficit, mostly through an increase in the corporate tax rate from 19% to 25% and through the freezing of income-tax thresholds.
Circling back to the MSCI World ex USA Index, there is one concern worth highlighting. Although not as high as the valuation metrics found in the US stock market, equities outside the US still appear expensive. We highlight this in Exhibit 11, which tracks the MSCI World ex USA Index and compares the actual index price to the different levels that would be achieved at various forward price-to-earnings ratios. The parallel lines in the chart reflect the trajectory of analysts’ forward earnings estimates. Currently, the actual index is priced at almost 17 times the earnings per share forecast for the next 12 months. The forward price-to-earnings ratio has not been this high since 2004.
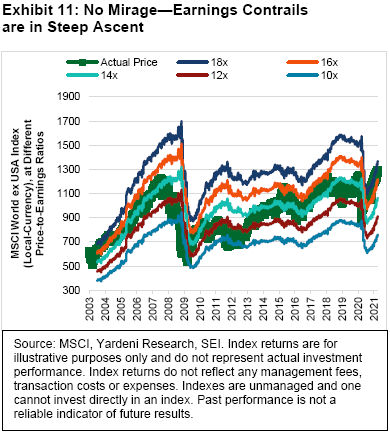
Analysts’ earnings projections probably will need to climb steadily in order for equities to continue their strong run. In the next year or two, this should not be a tall order. As the world’s economies reopen, GDP and corporate profitability will likely continue to rise in a robust fashion. As in the early 2000s, a prolonged and significant improvement in profits growth should lead to higher stock prices. Even if earnings multiples contract, we expect developed-economy equity markets outside of the US to move higher, with above-average gains that could potentially exceed the performance of the MSCI USA Index.
To repeat, developed-country stock markets around the world still look cheap compared to US equities. Because the forward price-to-earnings ratio for the MSCI USA Index is still above 22, it trades at an unusually wide 25% discount. Although longer-term growth differentials justify a structurally higher multiple for US equities, rebounding economies and rising interest rates should lead to a narrowing of the valuation gap.
Emerging markets: A tempered taper tantrum?
The jump in US bond yields this year has raised investor concerns that emerging countries’ equity and bond markets will be the victims of a 2013-style “taper tantrum.” Back then, the Fed signalled that it would start to taper its purchases of US Treasurys and mortgage-backed securities. Financial markets did not take the news well, with emerging markets hit particularly hard. At SEI, however, we believe that emerging economies are generally in a better position to withstand the pressure of rising rates than they were eight years ago.
Strong growth in the world economy over the next year should help lift most emerging-market stocks. World trade volumes, for example, already reached pre-pandemic levels by the end of last year, as shown in Exhibit 12.
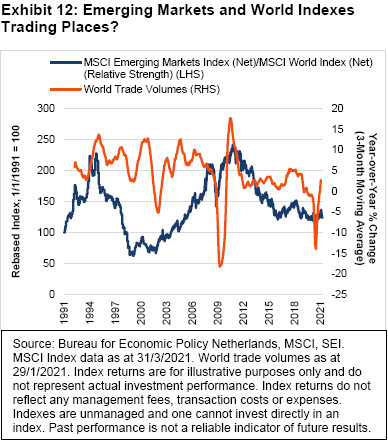
We believe the expansion in trade should continue over the course of 2021, perhaps reaching or exceeding the year-on-year gains of 5% recorded in 2017. When global trade volumes are strong, as they were during China’s spectacular 2001-to-2006 and 2008-to-2010 growth phases, developing-country stock markets tend to perform well against those of economically advanced countries. Note that the relative performance of the MSCI Emerging Markets Index against the MSCI World Index peaked in late 2010, well before the taper tantrum of 2013. Although trade volumes were still solid at that time, the slowing of China’s growth rate was enough to upend the decade-long bull market in emerging-market equities.
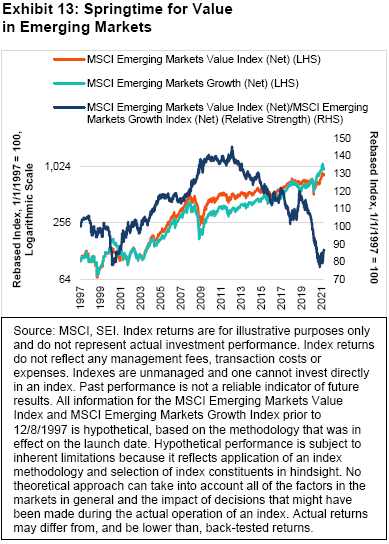
In our view, the economic backdrop strongly supports cyclical and value-oriented equities in emerging markets, just as it does in developed markets. Exhibit 13 shows that the MSCI Emerging Markets Value Index (total return) is highly correlated with industrial commodity prices. Obviously, commodity prices have already vaulted higher from year-ago lows. Perhaps there will be some consolidation of these gains as investors react to the combination of extended lockdowns in Europe and higher bond yields.
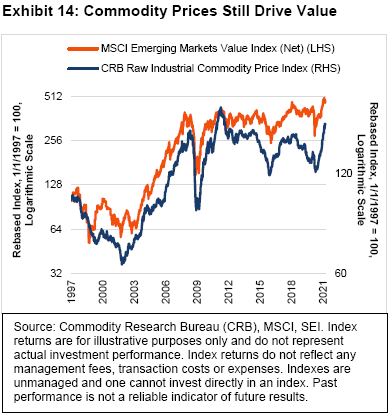
At SEI, however, we believe that more commodity-price gains are on the way. Exhibit 14 compares the current rebound in raw industrial commodity prices against the last three major bull runs (2002 to 2008, 2008 to 2011 and 2016 to 2018). The current bull market has surpassed the 2016-to-2018 upcycle in magnitude, but amounts to only half the increase recorded during the two earlier bull phases.
Demand for metals and other commodities should get a boost from several sources including strong manufacturing and construction demand in the US and China; the recovery in Europe and Latin America as vaccines become more widely available; the global push for electric vehicles and other climate-projects; and the coming US infrastructure package. To put it simply, China will not be the only country driving commodity inflation this time around.
Another reason that emerging economies appear less susceptible to a 2013-style taper tantrum is that their external trade positions are much healthier today. Exhibit 15 illustrates that current-account balances as a percentage of GDP are either in surplus or generally in a much smaller deficit position than they were eight years ago.
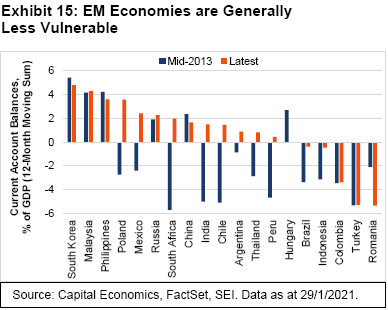
Granted, some big countries face continuing problems. Turkey is one major country that has failed to log an improvement in its external-trade balance. To make matters worse, its economic policy has turned increasingly erratic under President Tayyip Erdogan. He has replaced the head of Turkey’s central bank three times in the past two years. These changes have resulted in a sharp decline in the Turkish lira and caused investor capital to flow out of the country.
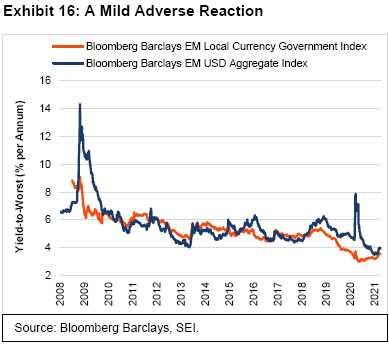
Exhibit 16 indicates that US dollar and emerging-market local-currency bond yields have both moved higher this year. But the rise in bond rates has so far been quite modest, with option-adjusted spreads still near their lows of the past three years. This certainly does not yet qualify as a taper tantrum.
Besides Turkey, debt dynamics among the larger emerging-market countries appear most worrying in Brazil and South Africa. However, most debt in these two countries is denominated in local currency, which allows their governments to engage in some form of financial repression (like quantitative easing) in order to temper the pressure on their bond markets.
Keep your eye on the road ahead and your hands upon the wheel
At SEI, our base case is an optimistic one. As vaccines continue to roll out throughout the world in the months ahead, countries will be able to end their lockdowns and reopen their economies. Business activity should therefore charge ahead, not just in the US and Europe but in other advanced nations too. Developing countries will likely take longer to reopen fully since their vaccination distribution will take time—yet their economies should improve on the upswing in developed-market consumer demand.
SEI’s equity and fixed-income portfolios have benefited from changes in the investment landscape that have already occurred over the past several months; our managers believe they are well positioned for what comes next. Value/cyclical stocks are expected to outperform both momentum and growth stocks. Global equities still have great potential to outpace the tech-heavy US large-cap market. In the global fixed-income market, credit remains favoured over sovereign debt; higher-yielding corporates and emerging markets should maintain their advantage in an investment world that offers few avenues for positive inflation-adjusted returns.
However, having confidence is not the same as being complacent. We continue to track the progression of the virus, the evolution of fiscal and monetary policies, and market fundamentals. In recent weeks, for example, investors have been forced to reassess the speed at which the world economy can return to normal. The near-term rollout of vaccines throughout the EU has been slow (to put it politely), delaying the region’s anticipated rebound.
We expect vaccine-related delays to be resolved in a matter of months—at least in the richer, more economically advanced countries. That noted, although the news out of Israel and the UK looks quite good as both are well along the road to vaccinating their respective populations, there is always the possibility that a variant will prove resistant to the vaccines currently on the market. Ironically, the countries that have been most successful in keeping COVID-19 at bay—China, Taiwan, South Korea, Japan, Australia—may be the ones at most risk since they are nowhere near herd-immunity levels. These countries also have been slow in rolling out vaccines, or, in the case of China, face a high degree of vaccine scepticism.
Beyond COVID-19 concerns, we are monitoring investor reaction to government policy moves. We previously noted the huge amount of fiscal stimulus that has been put in place and the equally expansive monetary policy measures employed by the Fed. In the coming months, investors will be increasingly focused on the next big multi-trillion dollar spending package dealing with infrastructure, climate change and a variety of Democratic-favoured social priorities. Tax increases on corporations and high-income households will also be part of this package. As was the case with the recently passed stimulus, the Democrats in the Senate will use the reconciliation process to move the tax and spending program through the chamber on a majority vote. It is doubtful, however, that they will succeed in pushing through all of the proposed measures. Compromises will be necessary to keep their caucus unified. It also is unclear how investors will react as the debate in Washington heats up, especially to the proposed tax increases.
The tax and regulatory changes championed by the Biden administration are not considered business- or stock-market friendly. The same could have been said of the economic policies pursued during former President Barack Obama’s tenure—but nevertheless one the strongest and most enduring bull-market runs in US history persisted. Today, while there’s little doubt that there will be winners and losers both at the industry level and among individual companies, we believe (as always) it is important to refrain from making broad asset-allocation changes based on perceived shifts in the political winds.
As for US monetary policy, we will be watching whether the Fed can maintain its stance of keeping the federal-funds rate near zero through 2023. The federal-funds rate futures market has already priced in the possibility of two or three interest-rate hikes. It all comes down to the path of inflation. If the acceleration in measured inflation proves stronger and longer-lasting than investors expect, bond yields could climb appreciably from today’s levels. How will the US central bank react? Will it lean against that rise in inflation even if the economy is still a distance away from the Fed’s employment goals? Or will the central bank try to suppress the increase in bond yields through quantitative-easing measures or a Japanese-style yield-curve control strategy? If the Fed brings forward policy-rate hikes, we would expect a neutral-to-negative reaction in stocks and other risk assets. Suppressing the rise in bond yields through even more aggressive policy actions, on the other hand, could lead to a weaker US dollar and a sharper investor focus on inflation-hedging strategies and beneficiaries. Stock valuations could get even more expensive than they are now as investors grow even more exuberant. Interesting times, indeed.
What actions are our portfolio managers taking?
Within US large cap, it was a good quarter for value, but not exceptional when compared to the long-term moves that followed past periods of underperformance. Our portfolios have slightly reduced their value positions, taking profits as prices rose. Positioning remains pro-value, we are just not allowing it to grow due to outperformance. Financials still look attractive, while retail and energy look less so given recent price gains. Even though the stocks of some low-risk, more stable companies (consumer staples, healthcare) have gotten cheap, there’s not much of an opportunity for information technology as the sector remains expensive.
For US small caps, we are seeing a different market than we did during most of 2020. The breadth of active management appears to be finally turning a corner as markets seem to be focusing more on investment fundamentals and valuations than on growth. Still, there has been a junk-rally component to small caps as companies without any earnings continue to outperform, just to a lesser degree than previously. Portfolio positioning remained the same, with the largest overweights to value-, quality- and stability-oriented stocks. We are still looking to see more of a rebound in quality and stability.
The market environment has also been supportive for our international equity portfolios. With value stocks enjoying positive earnings momentum, we have been witnessing positive earnings revisions. Generally speaking, our value managers were already positioned for this environment, and therefore maintained their pro-cyclical bias. While our momentum weighting remained roughly the same, its composition began to change. As the COVID-19 selloff started to disappear from the trailing one-year data, quantitative and momentum managers have been more positive on cyclical sectors such as financials and energy and less positive on defensive sectors. This rotation looks to have some staying power, and our portfolios may begin to shift to a more pro-value, pro-cyclical position as a result.
In global fixed-income markets, yields are still low, and we expect some headwinds for the time being. Still, the current rise in real rates may be self-limiting—it could spook risk-asset investors and cause a rotation back into fixed income. In this environment, we believe credit-sensitive assets have the potential to outperform. Within corporate credit, we have a preference for lower-quality and shorter-maturity issues, which limits our sensitivity to rates. Overall, we remain pro-cyclically positioned for the potential of a global reflationary environment.
Emerging-market equities, especially in Russia and South Africa, have gotten a boost from the rebound in energy prices. Our portfolios have mostly maintained their positioning from the prior period. Frontier markets have struggled a bit compared to emerging markets; where applicable, we have trimmed frontier weights.
While policy rates for most developed countries remain reasonably anchored, we are seeing expectations for higher rates in emerging markets. Overall there is now a 0.50% hike priced into the emerging-markets debt yield curve, although we note that rates are still relatively low. Portfolio positioning remained fairly stable; an underweight to Eastern Europe has worked well. Nominal rates moved higher, but 12-month inflation expectations remained steady at 3.0% so real yields have risen. Currency exposures have been a challenge with the portfolio overweight local-currency debt while the US dollar appreciated.
Standardised Performance
Important Information
This material is not directed to any persons where (by reason of that person's nationality, residence or otherwise) the publication or availability of this material is prohibited. Persons in respect of whom such prohibitions apply must not rely on this information in any respect whatsoever. Investment in the funds or products that are described herein are available only to intended recipients and this communication must not be relied upon or acted upon by anyone who is not an intended recipient.
This material represents an assessment of the market environment at a specific point in time and is not intended to be a forecast of future events, or a guarantee of future results. While considerable care has been taken to ensure the information contained within this document is accurate and up-to-date, no warranty is given as to the accuracy or completeness of any information and no liability is accepted for any errors or omissions in such information or any action taken on the basis of this information.
SEI Investments (Europe) Limited (SIEL) acts as distributor of collective investment schemes which are authorised in Ireland pursuant to the UCITS regulations and which are collectively referred to as the “SEI Funds” in these materials. These umbrella funds are incorporated in Ireland as limited liability investment companies and are managed by SEI Investments Global Limited, an affiliate of the distributor. SEI Investments (Europe) Limited utilises the SEI Funds in its asset management programme to create asset allocation strategies for its clients. Any reference in this document to any SEI Funds should not be construed as a recommendation to buy or sell these securities or to engage in any related investment management services. Recipients of this information who intend to apply for shares in any SEI Fund are reminded that any such application must be made solely on the basis of the information contained in the Prospectus (which includes a schedule of fees and charges and maximum commission available). Commissions and incentives may be paid and if so, would be included in the overall costs.) A copy of the Prospectus can be obtained by contacting your Financial Advisor, SEI Relationship Manager or by using the contact details shown below.
Data refers to past performance. Past performance is not a reliable indicator of future results. Investments in SEI Funds are generally medium- to long-term investments. The value of an investment and any income from it can go down as well as up. Returns may increase or decrease as a result of currency fluctuations. Investors may get back less than the original amount invested. SEI Funds may use derivative instruments which may be used for hedging purposes and/or investment purposes. This material represents an assessment of the market environment at a specific point in time and is not intended to be a forecast of future events.
In addition to the usual risks associated with investing, the following risks may apply: Bonds and bond funds are subject to interest rate risk and will decline in value as interest rates rise. High-yield bonds involve greater risks of default or downgrade and are more volatile than investment-grade securities, due to the speculative nature of their investments. International investments may involve risk of capital loss from unfavourable fluctuation in currency values, from differences in generally accepted accounting principles or from economic or political instability in other nations. Emerging markets involve heightened risks related to the same factors as well as increased volatility and lower trading volume. Narrowly focused investments, securities focusing on a single country, and investments in smaller companies typically exhibit higher volatility.
The opinions and views in this commentary are of SIEL only and are subject to change. They should not be construed as investment advice.
This information is issued by SEI Investments (Europe) Limited (SIEL) 1st Floor, Alphabeta, 14-18 Finsbury Square, London EC2A 1BR, United Kingdom. SIEL is authorised and regulated by the Financial Conduct Authority (FRN 191713).
Issued in South Africa by SEI Investments (South Africa) (Pty) Ltd. FSP No. 13186 which is a financial services provider authorised and regulated by the Financial Sector Conduct Authority (FSCA). Registered office: 3 Melrose Boulevard, 1st Floor, Melrose Arch 2196, Johannesburg, South Africa.
A number of sub-funds of the SEI Global Master Fund plc and the SEI Global Investment Fund plc (the “SEI UCITS Funds”) have been approved for distribution in South Africa under s.65 of the Collective Investment Schemes Control Act 2002 as foreign collective investment schemes in securities. If you are unsure at any time as to whether or not a portfolio of SEI is approved by the Financial Sector Conduct Authority (“FSCA”) for distribution in South Africa, please consult the FSCA’s website (www.fsca.co.za).
Collective Investment Schemes (CIS) are generally medium to long term investments and investors may not get back the amount invested. The value of participatory interests or the investment may go down as well as up. SEI does not provide any guarantee either with respect to the capital or the return of an SEI UCITS Fund. The SEI UCITS Funds are traded at ruling prices and can engage in borrowing and scrip lending. A schedule of fees and charges and maximum commissions is available upon request from SEI. The SEI UCITS Funds invest in foreign securities. Please note that such investments may be accompanied by additional risks such as: potential constraints on liquidity and the repatriation of funds; macroeconomic, political/emerging markets, foreign currency risks, tax and settlement risks; and limits on the availability of market information.
For full details of all of the risks applicable to our funds, please refer to the fund’s Prospectus. Please contact your fund adviser (South Africa contact details provided above) for this information.
This commentary is intended for information purposes only and the information in it does not constitute financial advice as contemplated in terms of the Financial Advisory and Intermediary Services Act.
SEI sources data directly from FactSet, Lipper, and BlackRock unless otherwise stated.


