Has Value’s Run Just Begun? Part 4: Active-Passive Reaches a Tipping Point
The nascent rotation to value that we began to explore in the first three papers of this series has implications for the active-versus-passive strategy debate. Based on history, and the extreme valuations of traditional passive strategies, we believe that value’s turn in the driver’s seat will spur a favourable period for active management. Looking at the past also provides a window into the types of active strategies that will most likely prevail as value takes the lead.
Active versus passive: Sometimes it’s a size issue
Active management comprises an entire universe of investment strategies. In aggregate, however, they tend to be more diversified than traditional passive indexes. Recall that traditional passive indexes are market-capitalisation-weighted (cap-weighted), which means that the largest publically traded companies (as measured by the total value of their stock prices) account for the greatest portions of a given index. For example, five companies accounted for a 23.6% share of S&P 500 Index market capitalisation as of 7 May 20211. Those same five companies accounted for only 14.8% of the S&P 500’s expected earnings over the next year, showing how a top-heavy index can become inefficient from a profitability standpoint1.
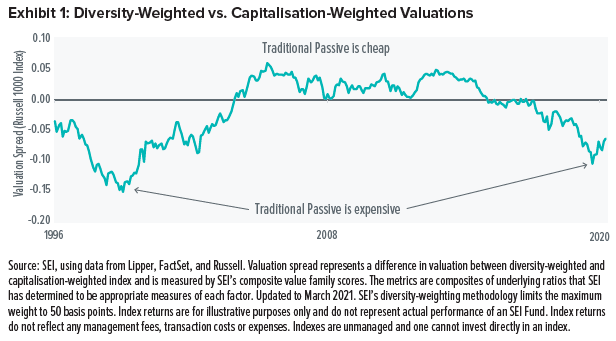
Indexes can also be calculated using different weighting methods for each stock. We have found that comparing a traditional cap-weighted index to its so-called diversity-weighted counterpart can reveal whether traditional passive portfolios are cheap or expensive at a given point in time. Diversity-weighted indexes limit the size of the largest stocks to ensure they don’t dominate index performance.
Traditional passive is not only expensive right now—it is extremely so from a historical perspective (Exhibit 1 on the next page).
There’s no getting away from the fact that active management as a whole is intertwined with the valuation cycle that we presented in Exhibit 1. History tells us that as indexes become more concentrated—that is, the top-weighted names grow larger while the smaller names shrink—their performance and valuations move further away from those of actively managed strategies.
This is especially clear if you think about active management in terms of deviation from a benchmark index. Market cap is the dominant metric for creating traditional passive strategies, so we can expect a great deal of their performance difference versus the average active manager to be driven by active preferences for companies other than those at the top of the index.
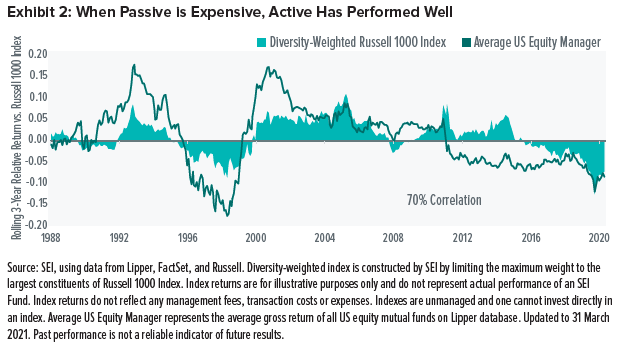
Put another way, we can use diversity versus concentration as a proxy for the tension between active and passive strategies. Exhibit 2 depicts the historically tight relationship between the average US equity manager and a diversity-weighted US equity index when comparing each against a traditional cap-weighted US equity index. These two sets of relative performance (that is, the average equity manager vs. a cap-weighted index and a diversity-weighted index vs. a cap-weighted index) have a 70% correlation.
Perhaps unsurprisingly, periods in which traditional passive has grown extremely expensive have historically been followed by superior performance from active strategies (Exhibit 2).
Active versus active: Lessons from the last great rotation to value
History tells us that as traditional passive leadership continues to give way to more diversified strategies, we should expect a shift in the types of active strategies that could lead in the coming years.
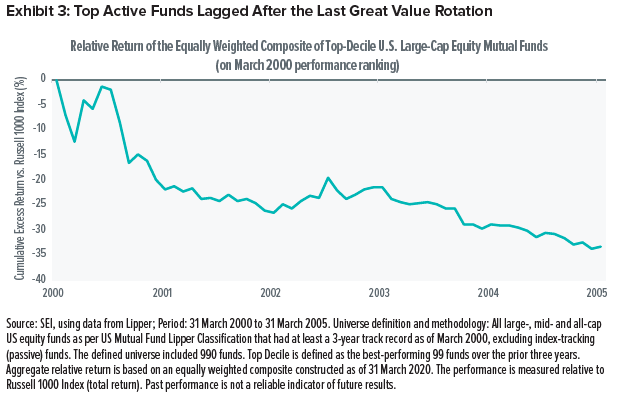
During the last strong rotation to value at the end of the dot-com bubble, active management was completely upended: US equity mutual funds that had produced top-decile performance in the three-year period through March 2000 proceeded to lag the broad US equity market during the subsequent five years (Exhibit 3).
Our View
Passive equity strategies surged in popularity over the recent historically long bull market, and now account for more assets under management than active equity strategies2. Yet the entire premise of passive investing—which is that passive investors can benefit from the market efficiency produced by the allocation decisions of active investors—has begun to reveal its inherent limitations as traditional passive has outgrown active. And history shows that this is not an isolated phenomenon. The concept continues to be self-defeating on a cyclical basis as passive strategies gravitate toward inefficient concentration and grow top-heavy and expensive. Active strategies, meanwhile, can still make efficient decisions about where to invest their capital.
The final entry in this series—Has Value’s Run Just Begun? Part 5: The Value in Rising Rates—explores how the history of rising interest rates has impacted value and other factors.
Glossary
Active management: Active managers aim to outperform a specific index, or benchmark. An active manager will continuously monitor and make changes to investments in an attempt to maximise returns.
Bull market: A bull market refers to a market environment in which prices are generally rising (or are expected to rise) and investor confidence is high.
Dot-com bubble: The dot-com bubble was a period during the late 1990s that coincided with the rapid growth and adoption of the internet. Speculation in the shares of internet-related companies resulted in a stock-market bubble that ultimately began to collapse in early 2000.
Passive index strategy: A passive index investment strategy generally uses the constituents of an index to dictate the investment portfolio’s composition. Market-capitalisation-weighted indexes served as the basis for the first passive strategies and remain the most popular type.
Rotation: Rotation is the movement of capital from one group of shares, sectors or investment styles to another as investors anticipate the next stage of the economic cycle.
Value: Value stocks are those that are considered to be cheap and are trading for less than they are worth.
Index Definitions
Russell 1000 Index: The Russell 1000 Index includes 1,000 of the largest U.S. equity securities based on market cap and current index membership; it is used to measure the activity of the U.S. large-cap equity market.
S&P 500 Index: The S&P 500 Index Index is an unmanaged market-capitalization-weighted index comprising 500 of the largest publicly traded U.S. companies and is considered representative of the broad US stock market.
Important Information
This material represents an assessment of the market environment at a specific point in time and is not intended to be a forecast of future events or a guarantee of future results. Positioning and holdings are subject to change. All information as of the date indicated. There are risks involved with investing, including possible loss of principal. This information should not be relied upon by the reader as research or investment advice, (unless you have otherwise separately entered into a written agreement with SEI for the provision of investment advice) nor should it be construed as a recommendation to purchase or sell a security. The reader should consult with their financial professional for more information.
Statements that are not factual in nature, including opinions, projections and estimates, assume certain economic conditions and industry developments and constitute only current opinions that are subject to change without notice. Nothing herein is intended to be a forecast of future events, or a guarantee of future results.
Certain economic and market information contained herein has been obtained from published sources prepared by other parties, which in certain cases have not been updated through the date hereof. While such sources are believed to be reliable, neither SEI nor its affiliates assumes any responsibility for the accuracy or completeness of such information and such information has not been independently verified by SEI.
There are risks involved with investing, including loss of principal. The value of an investment and any income from it can go down as well as up. Investors may get back less than the original amount invested. Returns may increase or decrease as a result of currency fluctuations. Past performance is not a reliable indicator of future results. Investment may not be suitable for everyone.
This material is not directed to any persons where (by reason of that person’s nationality, residence or otherwise) the publication or availability of this material is prohibited. Persons in respect of whom such prohibitions apply must not rely on this information in any respect whatsoever.
The information contained herein is for general and educational information purposes only and is not intended to constitute legal, tax, accounting, securities, research or investment advice regarding the strategies or any security in particular, nor an opinion regarding the appropriateness of any investment. This information should not be construed as a recommendation to purchase or sell a security, derivative or futures contract. You should not act or rely on the information contained herein without obtaining specific legal, tax, accounting and investment advice from an investment professional.
Information in the US is provided by SEI Investments Management Corporation (SIMC), a wholly owned subsidiary of SEI Investments Company (SEI).
Information provided in Canada by SEI Investments Canada Company, the Manager of the SEI Funds in Canada.
Information issued in the UK by SEI Investments (Europe) Limited, 1st Floor, Alphabeta, 14-18 Finsbury Square, London EC2A 1BR which is authorised and regulated by the Financial Conduct Authority. Investments in SEI Funds are generally medium- to long-term investments.
SIEL has appointed SEI Investments (Asia) Limited (SEIAL) of Suite 904, The Hong Kong Club Building, 3 Jackson Road, Central, Hong Kong as the sub-distributor of the SEI UCITS funds. SEIAL is licensed for Type 4 and 9 regulated activities under the Securities and Futures Commission (“SFC”)
This information is being made available in Hong Kong by SEIAL. The contents of this document have not been reviewed by any regulatory authority in Hong Kong. You are advised to exercise caution in relation to the offer. If you are in any doubt about any of the contents of this document, you should obtain independent professional advice.
This information is made available in Latin America FOR PROFESSIONAL (non-retail) USE ONLY by SIEL.
Any questions you may have in relation to its contents should solely be directed to your Distributor. If you do not know who your Distributor is, then you cannot rely on any part of this document in any respect whatsoever.
Issued in South Africa by SEI Investment (South Africa) (Pty) Limited FSP No. 13186 which is a financial services provider authorised and regulated by the Financial Sector Conduct Authority (FSCA). Registered office: 3 Melrose Boulevard, 1st Floor, Melrose Arch 2196, Johannesburg, South Africa.


