Has Value’s Run Just Begun? Part 2: A Long and Winding Path
From the beginning of 1995 to March 2000, just about any company with a “.com” suffix in its name enjoyed rising stock prices in a charging bull market. The Nasdaq Composite Index, home to most internet companies, rose by approximately 570% in cumulative terms as growth stocks (some of which had no hope of ever generating any earnings) trounced their value counterparts. Legendary value investor Warren Buffet famously avoided tech stocks at the time and faced criticism that he was out of touch for sticking to the traditional value approach, which is based on fundamental analysis designed to find quality companies selling at attractive prices1.
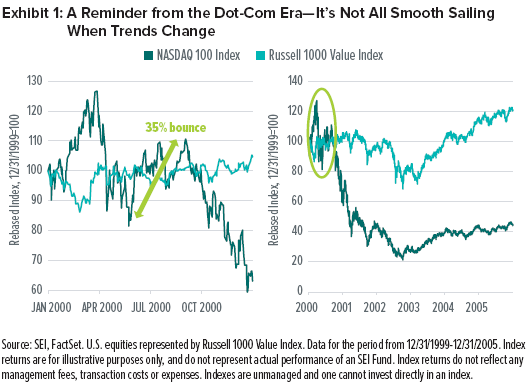
Buffet and other investors with a value orientation were proven right when investors realized that many of the companies were trading at stock prices that were unlikely to ever be justified by earnings (a situation stock traders often refer to as a “bubble”) and prices crashed. That relief appeared to be short-lived (as shown in Exhibit 1). Just over three months later, a 35% bounce in the NASDAQ 100 Index from the initial selloff once again provided a boost to tech shares and reason to doubt the fundamental case for value shares. Yet, we know with the benefit of hindsight that value ultimately prevailed in the ensuing years. Unfortunately, that knowledge is little consolation for investors who gave up on value shares when tech stocks temporarily rebounded. The lesson here: trends are long term in nature but short-term reversals are not uncommon.
Recent market events have started to follow a similar pattern to those of 20 years ago, with both featuring a short period of great performance by value stocks following a deeply challenging period. These are case studies in mean reversion—the tendency of capital markets to reverse course when they’ve reached extremes and move back toward long-term-average conditions. Again, these trends don’t move in a straight line. Like those investors who rejected value during the tech bubble days, we believe investors who are currently rushing to decrease their value exposure—so soon after its rebound from extreme undervaluation—face higher odds of missing out on potentially greater returns as the asset class continues to ascend.
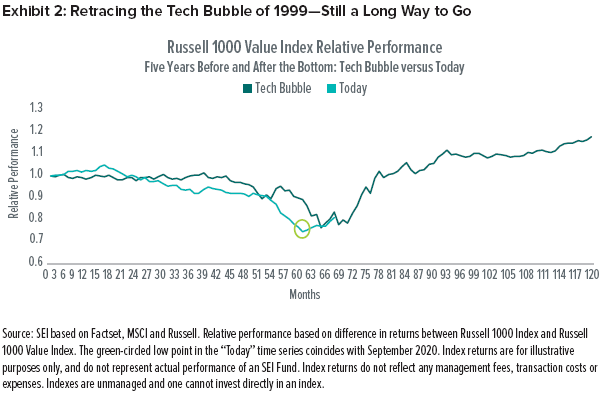
While we recognize there are significant differences between today and 20 years ago, we think the comparison between the current environment and the tech bubble provides useful context in understanding how a strong rotation to value leadership can play out. The path is often long and winding, but history shows that growth stocks will not lead the market forever (Exhibit 2).
SEI’s View
The comparison between current and past market reversals and, more importantly, the economic and fundamental underpinnings of value’s leadership (which we addressed in Has Value’s Run Just Begun? Part 1: The Economic and Fundamental Case) underscore our reasons for believing in the durability of value’s advance.
The next entry in this series—Has Value’s Run Just Begun? Part 3: Value Stocks—Still a Good Time to Buy?—explores why the timing appears right for value from an opportunistic standpoint.
Glossary of Financial Terms
Bull market: A bull market refers to a market environment in which prices are generally rising (or are expected to do so) and investor confidence is high.
Growth stocks: Growth stocks exhibit steady price or earnings growth above that of the broader market.
Tech bubble: The tech bubble was a period during the late 1990s that coincided with the rapid growth and adoption of the internet. Speculation in the shares of internet-related companies resulted in a stock-market bubble that ultimately began to collapse in early 2000.
Index Definitions
Nasdaq 100 Index: The Nasdaq 100 Index is composed of the 100 largest, most actively traded U.S. companies listed on the Nasdaq stock exchange with the exception of financial-industry stocks.
Nasdaq Composite Index: The NASDAQ Composite Index is an unmanaged, market-capitalization weighted index that consists of all securities listed on the NASDAQ exchange. It is often used to gauge performance of global technology stocks.
Russell 1000 Index: The Russell 1000 Index includes 1,000 of the largest U.S. equity securities based on market cap and current index membership; it is used to measure the activity of the U.S. large-cap equity market.
Russell 1000 Value Index: The Russell 1000 Value Index measures the performance of the large-cap value segment of the U.S. equity universe. It includes those Russell 1000 Index companies with lower price-to-book ratios and lower expected growth values.
Important Information
This material represents an assessment of the market environment at a specific point in time and is not intended to be a forecast of future events or a guarantee of future results. Positioning and holdings are subject to change. All information as of the date indicated. There are risks involved with investing, including possible loss of principal. This information should not be relied upon by the reader as research or investment advice, (unless you have otherwise separately entered into a written agreement with SEI for the provision of investment advice) nor should it be construed as a recommendation to purchase or sell a security. The reader should consult with their financial professional for more information.
Statements that are not factual in nature, including opinions, projections and estimates, assume certain economic conditions and industry developments and constitute only current opinions that are subject to change without notice. Nothing herein is intended to be a forecast of future events, or a guarantee of future results.
Certain economic and market information contained herein has been obtained from published sources prepared by other parties, which in certain cases have not been updated through the date hereof. While such sources are believed to be reliable, neither SEI nor its affiliates assumes any responsibility for the accuracy or completeness of such information and such information has not been independently verified by SEI.
There are risks involved with investing, including loss of principal. The value of an investment and any income from it can go down as well as up. Investors may get back less than the original amount invested. Returns may increase or decrease as a result of currency fluctuations. Past performance is not a reliable indicator of future results. Investment may not be suitable for everyone.
This material is not directed to any persons where (by reason of that person’s nationality, residence or otherwise) the publication or availability of this material is prohibited. Persons in respect of whom such prohibitions apply must not rely on this information in any respect whatsoever.
The information contained herein is for general and educational information purposes only and is not intended to constitute legal, tax, accounting, securities, research or investment advice regarding the strategies or any security in particular, nor an opinion regarding the appropriateness of any investment. This information should not be construed as a recommendation to purchase or sell a security, derivative or futures contract. You should not act or rely on the information contained herein without obtaining specific legal, tax, accounting and investment advice from an investment professional.
Information in the U.S. is provided by SEI Investments Management Corporation (SIMC), a wholly owned subsidiary of SEI Investments Company (SEI).
Information provided in Canada by SEI Investments Canada Company, the Manager of the SEI Funds in Canada.
Information issued in the UK by SEI Investments (Europe) Limited, 1st Floor, Alphabeta, 14-18 Finsbury Square, London EC2A 1BR which is authorised and regulated by the Financial Conduct Authority. Investments in SEI Funds are generally medium- to long-term investments.
SIEL has appointed SEI Investments (Asia) Limited (SEIAL) of Suite 904, The Hong Kong Club Building, 3 Jackson Road, Central, Hong Kong as the sub-distributor of the SEI UCITS funds. SEIAL is licensed for Type 4 and 9 regulated activities under the Securities and Futures Commission (“SFC”)
This information is being made available in Hong Kong by SEIAL. The contents of this document have not been reviewed by any regulatory authority in Hong Kong. You are advised to exercise caution in relation to the offer. If you are in any doubt about any of the contents of this document, you should obtain independent professional advice.
This information is made available in Latin America FOR PROFESSIONAL (non-retail) USE ONLY by SIEL.
Any questions you may have in relation to its contents should solely be directed to your Distributor. If you do not know who your Distributor is, then you cannot rely on any part of this document in any respect whatsoever.
Issued in South Africa by SEI Investment (South Africa) (Pty) Limited FSP No. 13186 which is a financial services provider authorised and regulated by the Financial Sector Conduct Authority (FSCA). Registered office: 3 Melrose Boulevard, 1st Floor, Melrose Arch 2196, Johannesburg, South Africa.


