Has Value’s Run Just Begun? Part 1: The Economic and Fundamental Case
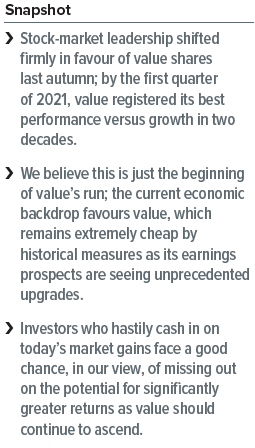
As equity markets pushed further into record-high territory around the world during the first quarter of 2021, value stocks posted their best performance versus growth shares in two decades (Exhibit 1). Investors may now be wondering how much fuel is left in the proverbial value tank, pressured by a sense of urgency to cash in while their holdings are still hot. We can appreciate the anxiety. However, not only do we view emotionally driven investment decisions as unwise, we have reason to believe that value stocks (cheaply priced companies) have a bright future on the equity-market stage.
Has Value’s Run Just Begun? is a five-part series dedicated to providing detailed insight into the rationale behind our conviction in value stocks. Each paper will address a specific topic, beginning with the economic and fundamental case for why we believe value leadership is just getting started.
The full series will explore:
- Positive economic drivers and favorable fundamental valuations that support the case for value
- Historical stock market patterns and reasons to remain patient when growth stocks may temporarily retake the lead
- Why the timing appears right for value from an opportunistic standpoint
- The types of strategies that we believe are best suited to capitalize on this potential value rotation
- How the history of rising interest rates has impacted value and other factors
Bargain prices on the frontrunner
Let’s start with the economic drivers and fundamental security analysis that give us good reason to have an optimistic outlook for value. At the macroeconomic level, the global economy has begun to recover from the COVID-19 pandemic—and cyclically oriented stocks (companies that sell discretionay products that consumers historically buy less frequently during economic downturns and more of during recoveries) have been the greatest beneficiaries of this growth. Meanwhile, cyclical stocks are often inexpensive relative to the broad market during slowdowns (think “value” stocks) because, by definition, cyclicals are affected by shifts in the economic cycle. Throughout the economic era of COVID-19, equities have adhered to this pattern. Now, we believe the economic floodgates are just beginning to reopen as vaccine distribution offers the potential to return to normal consumption patterns.
At a more granular economic level, manufacturing activity can serve as a useful proxy for the relative performance of value over time. Strong manufacturing growth, as measured by purchasing managers’ indexes (PMIs), implies accelerating economic activity—which, as we said, has an outsized benefit for cyclical companies. And manufacturing PMIs are expected to remain strong for the foreseeable future given the economic opportunity that reopening would provide.
Speaking of consumers…as US government stimulus checks hit consumers’ bank accounts, the nation’s personal savings rate has reached its highest levels on record (dating back to 1959)1. This suggests that residents of the world’s largest consumer market are well positioned to increase their personal spending.
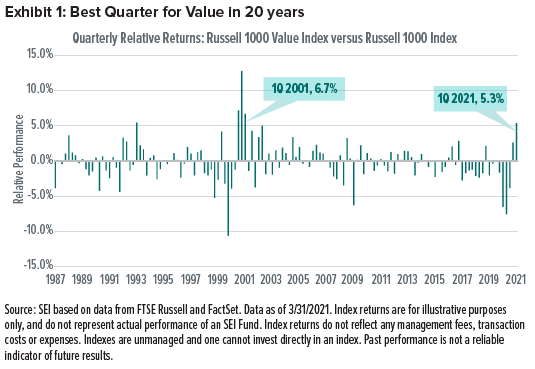
The improving prospects for value shares are also apparent as companies project future earnings—with estimates being revised upward (Exhibit 2). By plotting earnings upgrades and downgrades according to stock price valuations, we can see that cheap shares are being upgraded relative to expensive shares at the fastest rate we have seen dating back to 1997, the start of our dataset. What does this tell us? Earnings expectations for value shares over the coming year have improved so sharply that their valuations from just a few months ago have become obsolete at this point.
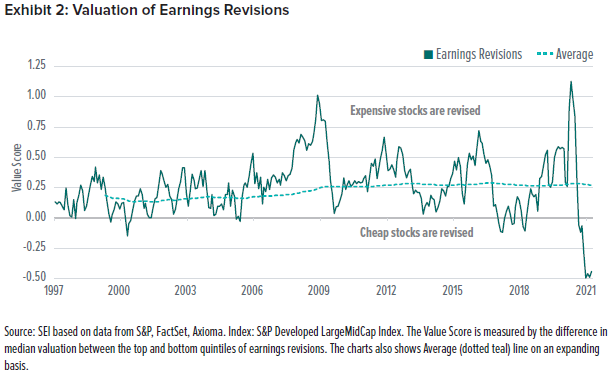
This sharply brightening outlook for value has coincided with a steep bargain in its pricing. Value shares began their run of outperformance last fall at historically inexpensive valuations (Exhibit 3). They’ve since grown less cheap, although not by much, and there are regional variations. Generally, the gap between growth and value stocks still has a long way to go before reverting to long-term averages across all regions.
SEI’s View
With the economic backdrop in favour of value, which remains extremely cheap by historical measures, its earnings prospects are being upgraded to the highest degree in at least several decades (and perhaps longer, as we are limited by the dataset). We therefore believe that value still has a long way to go as the star of this market cycle.
With that noted, we are under no illusions that it will be a smooth ride. The next entry in this series—Has Value’s Run Just Begun? Part 2: A Long and Winding Path—uses the tech bubble of the 1990s as a case study in exploring how a strong equity-market rotation to value can unfold in a halting and uneven manner that may test investor patience.
Glossary of Financial Terms
Cyclical stock: Cyclical stocks are those whose performance is closely tied to the economic environment and business cycle.
Growth: Growth stocks exhibit steady price or earnings growth above that of the broader market.
Purchasing managers’ index (PMI) survey: A PMI survey is compiled from responses to questionnaires sent to a panel of purchasing managers working, for example, in the manufacturing and business services sectors.
Index Definitions
Russell 1000 Index: The Russell 1000 Index includes 1,000 of the largest U.S. equity securities based on market cap and current index membership; it is used to measure the activity of the U.S. large-cap equity market.
Russell 1000 Value Index: The Russell 1000 Value Index measures the performance of the large-cap value segment of the U.S. equity universe. It includes those Russell 1000 Index companies with lower price-to-book ratios and lower expected growth values.
S&P Developed LargeMidCap Index: The S&P Developed LargeMidCap Index comprises the stocks representing the top 85% of float-adjusted market cap in each developed country.
S&P United States LargeMidCap Index: The S&P United States LargeMidCap Index comprises the stocks representing the top 85% of float-adjusted market capitalization in the U.S.
S&P Europe ex UK LargeMidCap Index: The S&P Europe ex UK LargeMidCap Index comprises the stocks representing the top 85% of float-adjusted market capitalization in Europe excluding the U.K.
S&P Japan Large MidCap Index: The S&P Japan LargeMidCap Index comprises the stocks representing the top 85% of float-adjusted market capitalization in Japan.
Important Information
This material represents an assessment of the market environment at a specific point in time and is not intended to be a forecast of future events or a guarantee of future results. Positioning and holdings are subject to change. All information as of the date indicated. There are risks involved with investing, including possible loss of principal. This information should not be relied upon by the reader as research or investment advice, (unless you have otherwise separately entered into a written agreement with SEI for the provision of investment advice) nor should it be construed as a recommendation to purchase or sell a security. The reader should consult with their financial professional for more information.
Statements that are not factual in nature, including opinions, projections and estimates, assume certain economic conditions and industry developments and constitute only current opinions that are subject to change without notice. Nothing herein is intended to be a forecast of future events, or a guarantee of future results.
Certain economic and market information contained herein has been obtained from published sources prepared by other parties, which in certain cases have not been updated through the date hereof. While such sources are believed to be reliable, neither SEI nor its affiliates assumes any responsibility for the accuracy or completeness of such information and such information has not been independently verified by SEI.
There are risks involved with investing, including loss of principal. The value of an investment and any income from it can go down as well as up. Investors may get back less than the original amount invested. Returns may increase or decrease as a result of currency fluctuations. Past performance is not a reliable indicator of future results. Investment may not be suitable for everyone.
This material is not directed to any persons where (by reason of that person’s nationality, residence or otherwise) the publication or availability of this material is prohibited. Persons in respect of whom such prohibitions apply must not rely on this information in any respect whatsoever.
The information contained herein is for general and educational information purposes only and is not intended to constitute legal, tax, accounting, securities, research or investment advice regarding the strategies or any security in particular, nor an opinion regarding the appropriateness of any investment. This information should not be construed as a recommendation to purchase or sell a security, derivative or futures contract. You should not act or rely on the information contained herein without obtaining specific legal, tax, accounting and investment advice from an investment professional.
Information in the U.S. is provided by SEI Investments Management Corporation (SIMC), a wholly owned subsidiary of SEI Investments Company (SEI).
Information provided in Canada by SEI Investments Canada Company, the Manager of the SEI Funds in Canada.
Information issued in the UK by SEI Investments (Europe) Limited, 1st Floor, Alphabeta, 14-18 Finsbury Square, London EC2A 1BR which is authorised and regulated by the Financial Conduct Authority. Investments in SEI Funds are generally medium- to long-term investments.
SIEL has appointed SEI Investments (Asia) Limited (SEIAL) of Suite 904, The Hong Kong Club Building, 3 Jackson Road, Central, Hong Kong as the sub-distributor of the SEI UCITS funds. SEIAL is licensed for Type 4 and 9 regulated activities under the Securities and Futures Commission (“SFC”)
This information is being made available in Hong Kong by SEIAL. The contents of this document have not been reviewed by any regulatory authority in Hong Kong. You are advised to exercise caution in relation to the offer. If you are in any doubt about any of the contents of this document, you should obtain independent professional advice.
This information is made available in Latin America FOR PROFESSIONAL (non-retail) USE ONLY by SIEL.
Any questions you may have in relation to its contents should solely be directed to your Distributor. If you do not know who your Distributor is, then you cannot rely on any part of this document in any respect whatsoever.
Issued in South Africa by SEI Investment (South Africa) (Pty) Limited FSP No. 13186 which is a financial services provider authorised and regulated by the Financial Sector Conduct Authority (FSCA). Registered office: 3 Melrose Boulevard, 1st Floor, Melrose Arch 2196, Johannesburg, South Africa.


