Growth Stocks: The Good, the Bad and the Ugly
A positive relationship between revenue growth and the price of company’s stock likely seems intuitive. It follows, then, that rising sales should lead to growing profitability, which should result in a rising stock price. Consider, for example, a coffee shop. Opening a second location just a few blocks down the same street as the first location would provide a second source of sales and, theoretically, an increase in revenue.
However, the reality may not be as lucrative as the theory. With a choice of two coffee shops just a short stroll from each other, some customers would likely switch from the first location to the second—resulting in zero revenue growth. Even if the second location attracts new customers, rather than simply offering existing customers an alternative location at which to make their purchases, successful businesses tend to attract competitors.
As newcomers attempt to imitate the original shop’s approach, a fall in prices and obtainable profit margins is not necessarily imminent but almost always inevitable. Even businesses that manage to dominate their competitors and achieve long-term success can face challenges. For example, a company that develops a dominant market share may attract regulatory scrutiny—and such oversight could curtail business activity or even breakup successful business models.
Growth ≠ rising stock prices
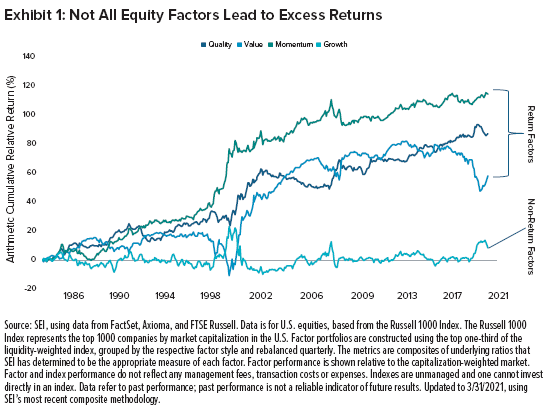
Where revenue growth and stock prices are concerned, long-term historical analysis does not support this supposedly intuitive assessment, as shown in Exhibit 1. While there have been short-term periods of excitement for growth stocks and growth-oriented investment strategies (including the 1999-to-2000 and 2019-to-2020 periods), they did not last. On the other hand, value, momentum and quality have each historically provided significant long-term results. We could not find any credible research documenting a positive relationship between growing revenues and stock-price performance.
Rare ≠ good
When seeking growth, it is especially hazardous to hunt for “unicorns,” a term usually applied to startup firms that have rapidly grown to valuations of $1 billion or greater. The so-called dot-com bubble in 2000 was an exuberant time before the lust for growth destroyed extraordinary amounts of investors’ capital.
Relying on the resolve of shareholders to continuously provide new capital for a miniscule chance of success can be particularly risky. Without profits, it is virtually impossible to distinguish true growth from hype. Yet, an enthusiasm for technology companies that is reminiscent of the 2000 dot-com era has taken hold in recent years, fueled by an abundance of cheap capital chasing a limited opportunity with a continual flow of investors’ capital pushing the prices of growth stocks higher and higher. This conviction was taken to new levels at the start of the COVID-19 pandemic in 2020. Still, as global economies began returning to normal in 2021, the relative investment returns of growth strategies did the same. In our view, this trend reversal should only strengthen in the years to come.
Big short?
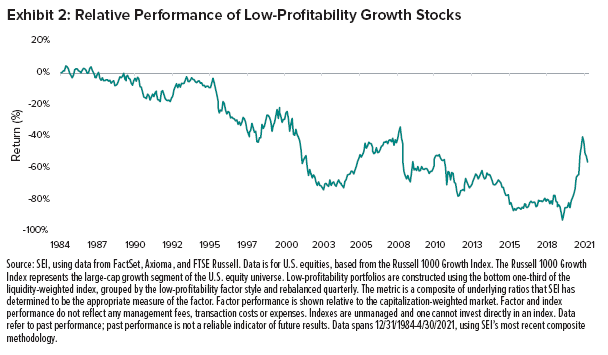
To illustrate the potential danger of unprofitable growth, we constructed a simple experiment. Exhibit 2 reflects a portfolio of Russell 1000 Growth Index constituents (reformed each quarter) with below-market profitability. The historical returns of such a strategy would have been quite attractive for a short seller over the last several decades.
Good stocks, wrong measurement
Traditional index providers employ simplified metrics to sub-divide the investment universe into “styles.” For example, FTSE Russell bases its value-growth split on a stock’s relative price-to-book ratio, forecasted medium-term growth, and historical growth in sales-per-share. In other words, stocks that appear expensive on a price-to-book (P/B) ratio and whose companies experienced faster than average sales growth, would be classified into a “growth” index, while others would be classified as “value.” However, there is nothing in this metric that measures a company’s earnings growth (which is what we believe should matter most to investors) or the quality of such growth.
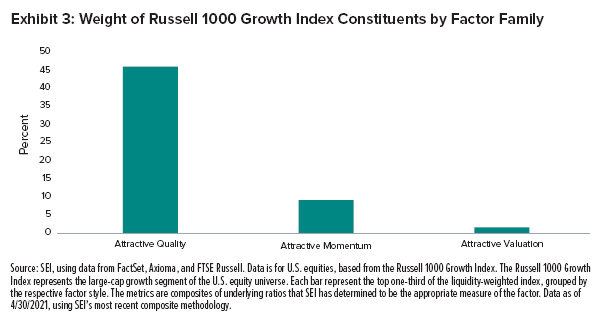
Many high-quality firms typically end up in either the Russell 1000 Growth Index or the Russell 2000 Growth Index simply because their P/B valuation is above average, regardless of whether they have superior returns on capital (which should in itself justify their inclusion). Numerous studies have shown that P/B is perhaps one of the worst valuation metrics for modern times as there can be challenges with intangible asset accounting, buybacks or historical prices. Indeed, we estimate that approximately half of the Russell 1000 Growth Index today (as of June 30, 2021) are high-quality stocks; the typical growth factor criticisms should not apply to them. Yet, we can’t find too many cheaply valued stocks among Russell 1000 Growth Index constituents, and their previously strong momentum has mostly disappeared. Still, as shown in Exhibit 3, there is quality—the kind of quality that generates long-term strategic outperformance and forms one of the strategic pillars of our investment approach.
Our View
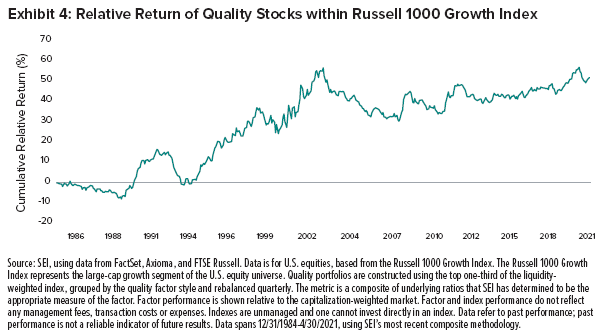
Our research shows, perhaps counterintuitively, that company growth alone has not generated excess returns for investors—and that low-profitability growth has not generated historical excess returns. Given this, we would argue that growth-style indexes, with their questionable metrics and two-dimensional views, are of little use to investors seeking to maximize their returns. While we do not broadly view growth as a consistent driver of excess returns, we do like many growth index constituents. Exhibit 4 shows the relative return of quality stocks within the Russell 1000 Growth Index.
We have said if before, and will say it again: There is no shortcut to long-term investment success. While trendy growth stocks grab headlines (and sometimes generate fast money for speculators), we believe that quality companies make for good investments.
The elevated prices of growth stocks today will likely unwind precisely as they did in the 2000s. To us, in a world of ever-evolving unknown unknowns, diversification appears to be the only prudent solution (as cliché as it may sound). At SEI, in an effort to help investors avoid the kind of loss that was widely inflicted by the tech bubble of the 2000s, we seek to construct portfolios that offer sufficiently broad allocations to stocks, industries and asset classes. As always, when the fashion of the day favors a few, we remain skeptical and look elsewhere.
Glossary
Buybacks occur when a company buys its own shares back to reduce the number of shares outstanding on the open market.
Dot-com bubble refers to a period in the late 1990s characterized by a rapid rise in U.S. technology stock valuations, especially internet-based companies.
Forecasted medium-term growth refers to estimates for company growth anywhere from two to 10 years in the future.
Historical prices are the recorded prices of an asset for a range of dates in the past.
Intangible asset accounting records an asset as a long-term holding and then amortizes the asset over its useful life.
Price-to-book ratio compares the market capitalization of a company to its net assets.
Sales per share is calculated by dividing a company’s total revenue by it total shares outstanding.
Index Definitions
Russell 1000 Growth Index measures the performance of the large-cap growth segment of the U.S. equity universe.
Russell 1000 Value Index measures the performance of the large-cap value segment of the U.S. equity universe.
Russell 2000 Growth Index measures the performance of the small-cap growth segment of the U.S. equity universe.
Important Information
This material represents an assessment of the market environment at a specific point in time and is not intended to be a forecast of future events or a guarantee of future results. Positioning and holdings are subject to change. All information as of the date indicated. This information should not be relied upon by the reader as research or investment advice, (unless you have otherwise separately entered into a written agreement with SEI for the provision of investment advice) nor should it be construed as a recommendation to purchase or sell a security. The reader should consult with their financial professional for more information.
Statements that are not factual in nature, including opinions, projections and estimates, assume certain economic conditions and industry developments and constitute only current opinions that are subject to change without notice. Nothing herein is intended to be a forecast of future events, or a guarantee of future results.
Certain economic and market information contained herein has been obtained from published sources prepared by other parties, which in certain cases have not been updated through the date hereof. While such sources are believed to be reliable, neither SEI nor its affiliates assumes any responsibility for the accuracy or completeness of such information and such information has not been independently verified by SEI.
There are risks involved with investing, including loss of principal. The value of an investment and any income from it can go down as well as up. Investors may get back less than the original amount invested. Returns may increase or decrease as a result of currency fluctuations. Past performance is not a reliable indicator of future results. Investment may not be suitable for everyone.
This material is not directed to any persons where (by reason of that person’s nationality, residence or otherwise) the publication or availability of this material is prohibited. Persons in respect of whom such prohibitions apply must not rely on this information in any respect whatsoever.
The information contained herein is for general and educational information purposes only and is not intended to constitute legal, tax, accounting, securities, research or investment advice regarding the strategies or any security in particular, nor an opinion regarding the appropriateness of any investment. This information should not be construed as a recommendation to purchase or sell a security, derivative or futures contract. You should not act or rely on the information contained herein without obtaining specific legal, tax, accounting and investment advice from an investment professional.
Information in the U.S. is provided by SEI Investments Management Corporation (SIMC), a wholly owned subsidiary of SEI Investments Company (SEI).
Information provided in Canada by SEI Investments Canada Company, the Manager of the SEI Funds in Canada.
Information issued in the UK by SEI Investments (Europe) Limited, 1st Floor, Alphabeta, 14-18 Finsbury Square, London EC2A 1BR which is authorised and regulated by the Financial Conduct Authority. Investments in SEI Funds are generally medium- to long-term investments.
SIEL has appointed SEI Investments (Asia) Limited (SEIAL) of Suite 904, The Hong Kong Club Building, 3 Jackson Road, Central, Hong Kong as the sub-distributor of the SEI UCITS funds. SEIAL is licensed for Type 4 and 9 regulated activities under the Securities and Futures Commission (“SFC”)
This information is being made available in Hong Kong by SEIAL. The contents of this document have not been reviewed by any regulatory authority in Hong Kong. You are advised to exercise caution in relation to the offer. If you are in any doubt about any of the contents of this document, you should obtain independent professional advice.
This information is made available in Latin America FOR PROFESSIONAL (non-retail) USE ONLY by SIEL.
Any questions you may have in relation to its contents should solely be directed to your Distributor. If you do not know who your Distributor is, then you cannot rely on any part of this document in any respect whatsoever.
Issued in South Africa by SEI Investment (South Africa) (Pty) Limited FSP No. 13186 which is a financial services provider authorised and regulated by the Financial Sector Conduct Authority (FSCA). Registered office: 3 Melrose Boulevard, 1st Floor, Melrose Arch 2196, Johannesburg, South Africa.


