Good News is Still Good News (Long Version)
It was full-steam ahead for both the global economic recovery and the worldwide rally in risk assets (equities, commodities, high-yield bonds, real estate, and currencies). Even a recent stumble stemming from an apparent shift in the US Federal Reserve’s expectations about interest-rate policy moves proved short-lived.
To be sure, COVID-19 is still wreaking havoc in parts of the world. As we entered the second half of the year, Latin America remained the epicentre of the disease with an infection rate that nearly doubled since December; several south Asian countries experienced flare-ups that outpaced their earlier episodes; and Australia and Israel re-imposed some restrictions to counter sharp surges in infection rates.
Despite these discouraging developments, the total number of new cases, hospitalisations and deaths have decreased significantly due to the ramp-up in vaccinations across North America and Europe, the seasonal shift to warmer weather in the northern hemisphere, and the ongoing lockdowns in harder-hit countries and regions.
Exhibit 1 highlights the progress the world has made in fighting the virus since the end of last year, tracked by the percentage change in the biweekly average of cases and deaths per million across the world’s most populous continents. In Asia, even as the number of cases per million jumped by 62% since December 2020, its biweekly average level remained below the (much-improved) readings in Europe and North America.
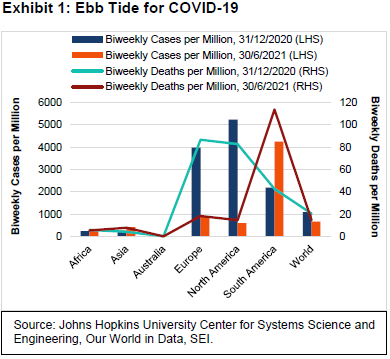
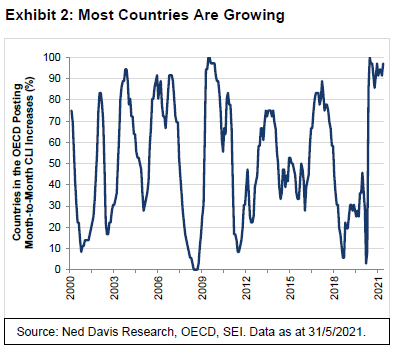
Exhibit 2 on the following page charts the percentage of countries with economies that are growing above trend (or should soon be), as measured by the Organisation for Economic Co-operation and Development’s (OECD) composite of leading indicators (CLIs). Over two-thirds of the countries for which the OECD calculates CLIs are currently in this category, with their most recent readings exceeding 100. In May, all but one of those countries had been posting month-to-month gains, pointing to additional near-term acceleration in global economic activity. Countries like Brazil and India are struggling to contain the virus but are nevertheless showing signs of economic recovery.
Equity markets have long anticipated the economic improvement we now are seeing. Exhibit 3 is an update to a chart we included in last quarter’s Economic Outlook that compares the total returns of the MSCI USA Index, the MSCI World ex USA Index, and the five largest country indexes within the MSCI World ex USA. In the latest quarter, performance was rather uniform across the major developed-country indexes, with total returns mostly ranging from 4% to 9%. Japan was the major exception, with its MSCI benchmark gaining only 0.2% for the same three-month period.
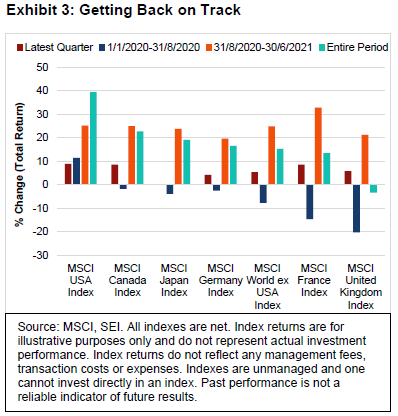
Since the end of August 2020, when financial and cyclical stocks began to outperform growth-oriented sectors, all but one of the indexes represented in the chart have exceeded 20% in cumulative returns. Germany just missed, with a 19.6% return. Aside from the MSCI United Kingdom Index, all now exceed the total-return levels that prevailed prior to the pandemic at the end of 2019.
This stellar performance, however, is beginning to make some market observers nervous. Cyclical stocks, financials and commodity prices pulled back sharply in the days following the mid-June US Federal Reserve (Fed) policy meeting. There is increasing concern that equity prices have risen so much that there is little appreciation potential left, even if the global economy continues to forge ahead into 2022.
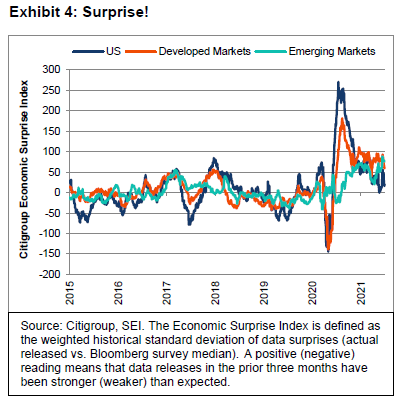
Investor expectations do appear to be catching up with the US economy’s performance. Exhibit 4 tracks Citigroup’s economic surprise index for developed and emerging economies, as well as for the US individually. “Peak surprise” for the US and other developed markets generally came in August 2020. Weekly readings have since remained positive (suggesting that economic releases have, on balance, been beating expectations), but their strength has faded. The US is getting closer to the zero mark, although other developed countries still appear to be surpassing forecasts at a decent pace. Emerging economies also seem to be generating positive data surprises on a consistent basis. At SEI, this is one reason why we believe international equity markets have the potential to outperform the US as their economies continue to rebound in the months ahead.
The big question likely nagging at investors: Does peak surprise also imply peak stock prices? Our answer is that no, it does not. However, we can’t rule out a choppier and more lacklustre performance for US equities in the coming months—given their elevated valuations relative to most other stock markets around the world and their strong outperformance in total-return terms since the start of the secular bull in March 2009. It is worth remembering that US equities have scored consistent gains with nary a correction since March 2020. This is rather unusual. According to data provided by Ned Davis Research as at June 2021, the S&P 500 Index has not had a correction of 5% or more in the past 167 trading days or a correction of 10% or more in the past 322 trading days (since the market bottomed on a closing basis on 23 March of last year).
The same Ned Davis data shows that historically, stock-market corrections of 5% to 10% have been quite common in the S&P 500 Index and its predecessor benchmark indexes that go back to 1928. The average number of consecutive trading days without such a pullback is just 51, while the average number of days without a 10% correction works out to be 172. In our view, the moral of the story is that it’s best not to be overly concerned when volatility increases in equity markets.
We are fond of saying that a 5%-to-10% correction can occur “just because,” as there need not be any fundamental reason behind the decline. A sharper drop in prices does usually have some connection to a fundamental event that causes expectations to shift more substantially. Nonetheless, if the longer-term trend is positive, we would view such a decline as a buying opportunity for stock-market traders with shorter time horizons. As we saw last year, even a big stock-price decline that qualifies as a bear market can be surprisingly short, if still brutal. In today’s environment, with economies around the world opening up and interest rates hovering at extraordinary low levels, the dominant trend signals further price gains over the next year or two.
Still, investors would be wise to consider that the US economy is not only well past “peak surprise,” but also appears to have reached “peak growth.” While it will likely continue to grow in excess of its long-term average for a few more quarters, the growth rate in overall inflation-adjusted gross domestic product (GDP) is expected to slow dramatically as the nation’s economy fully reopens. Exhibit 5 highlights the correlation between the Institute for Supply Management’s (ISM) purchasing managers’ index (PMI) for the manufacturing sector (ISM-M) and the relative performance of the S&P 500 Index (total return) versus the Bloomberg Barclays US Aggregate Bond Index (total return).
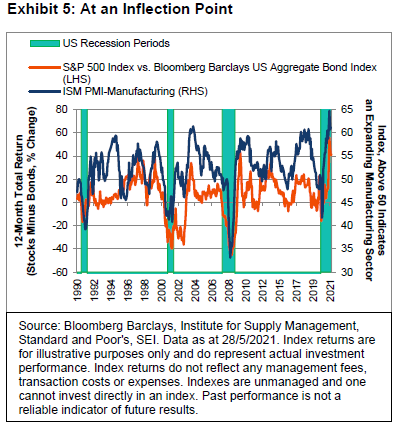
While the ISM-M achieved its peak reading in March, it remains above 60—a level that is seldom reached by this indicator of economic health. We expect it will stay well above the 50 line even as it continues to fade in the months ahead, pointing to further expected gains in the manufacturing sector. However, history shows that as the ISM-M declines, the degree of stock-market outperformance versus bonds ebbs as well. The closer the ISM-M gets to 50 (readings below 50 indicate contraction in the manufacturing sector and sluggish overall business activity), the greater the odds that stocks will lag bonds over a 12-month span. Note that growth slowdowns, not just recessions, can lead to equity underperformance versus bonds. During the 2009-to-2019 US economic expansion, bonds delivered better relative performance for three different 12-month periods (2012, 2016 and 2019).
The performance of equites versus bonds was obviously phenomenal over the past 15 months; a major narrowing of the performance gap is inevitable. Yet, with interest rates still at exceptionally low levels (in both nominal and inflation-adjusted terms), it is hard to see equities losing ground to fixed-income securities while economic growth remains so robust. Not only should consumer demand remain strong as the economy opens up, but businesses, are expected to be in a spending mood too as they desperately seek materials and workers.
Exhibit 6 tracks the overall manufacturing sector against the difference between two of its components: new orders and inventories. It should come as no surprise that new orders are far outpacing inventories. The difference between the two components is historically consistent with today’s ISM-M of 60. Although the shortages and supply-chain disruptions will eventually be resolved, we expect it will take months to happen.
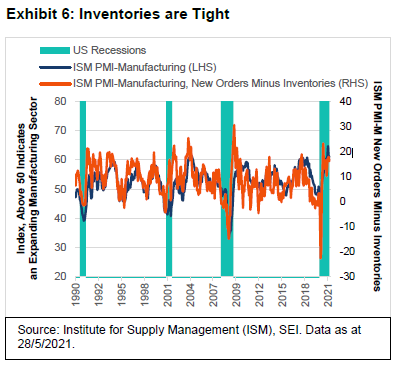
In the meantime, US companies in many industries and of all sizes will enjoy a great deal of pricing power and will almost certainly pass along at least a portion of their increased costs onto their customers.
Unfortunately, one person’s pricing power is another person’s inflation. The big question is whether the price pressures seen this year are transitory, as the US Fed and other central bankers around the world say they are. In the latest economic projections from the US Fed, the Federal Open Market Committee (FOMC) sharply raised its median forecast for its preferred measure of inflation (the personal-consumption expenditures (PCE) price index, excluding food and energy) to 3.0% from 2.2% just three months ago. Yet the FOMC’s inflation forecasts for 2022 and 2023 were barely changed from the median reading for both at 2.1%.
Investors in the bond market seem to agree with the Fed’s point of view. Although US bond yields rose sharply in the first quarter, they have fallen over the past three months. The 10-year US Treasury bond currently trades below 1.50%, a noticeable decline of about 0.25% since the end of March. However, if inflation continues to accelerate at the fastest pace in almost 30 years, there’s no telling how long bond investors will maintain such a calm perspective.
Exhibit 7 suggests that the patience of bond investors could be tested for quite some time. The chart highlights the year-on-year change in the headline PCE price index (which includes the more volatile food and energy components). The vertical bars on the chart represent a statistic developed by the St. Louis Fed called the price-pressures measure (PPM). It calculates the probability at 70% or more that PCE inflation will exceed 2.5%, on average, over the next 12 months (the Fed’s long-term inflation target is set at 2%).
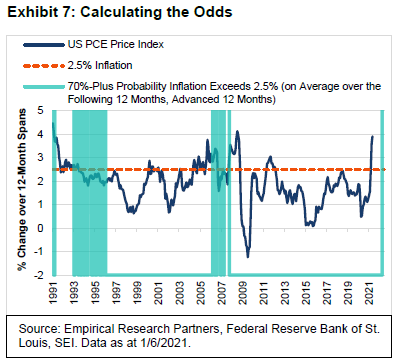
When charting the PPM, we advanced the series by 12-months in order to see how calculated probabilities have lined up with actual inflation reported one year later. This revealed that at the 70% probability level, actual inflation undershot the 2.5% mark for much of the period from 1993 to 1996. Between 2005 and 2008, on the other hand, PCE inflation spent a good amount of time above 2.5%—even during those intermittent periods when the probability level fell below 70%. Most recently, the PPM at the end of June 2021 showed a substantial 83% probability of inflation surpassing 2.5% one year later. Given the widespread prevalence of price inflation currently, we would not be surprised to see a string of PPM readings that exceed the 70% probability threshold for several more months.
If higher inflation becomes more deeply embedded than is currently anticipated by the US Fed and investors, it will most likely be the result of strong and persistent labour-cost pressures. In Exhibit 8 on the following page, we look at the US Department of Labour’s employment cost index (ECI) and compare it to the ratio of job openings to unemployed persons (including individuals who are actively looking for work and those who desire a job but are not actively searching for one). Prior to the pandemic, both joblessness and unemployment were at historically high levels. In fact, in the two years leading up to the pandemic, there were more jobs available than there were officially unemployed persons. Labour costs rose above 3% in the one-year period ending March 2020—its largest year-over-year increase since the third quarter of 2008. The ECI decelerated sharply as the US economy went into hibernation in the face of COVID-19 but has since rebounded modestly.
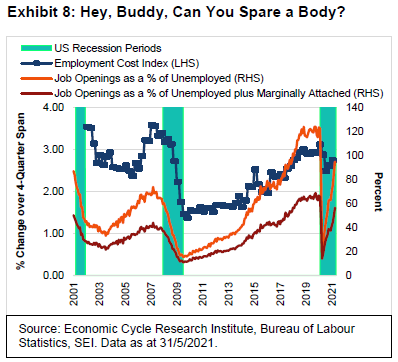
Job openings in the US are now soaring. Once again, the US economy is approaching the point of having nearly the same number of available jobs as there are officially unemployed persons—with the ratio quickly moving toward a previous high, even when including so-called marginally attached workers (those who desire a job but have not searched for employment in the prior four weeks). We expect labour-force participation to rise in the months ahead, but we also suspect that the labour market will nonetheless tighten further. If the rise in ECI accelerates as we expect, inflation could become a greater concern for investors than it appears to be at the moment.
Jobs can go begging to be filled for any number of reasons, even when there are many unemployed people. Positions may require skills that the currently unemployed do not possess, or they could be located in places where the unemployed are unwilling to go. Neither of these possible reasons seem to apply broadly in the current environment. Rather, enhanced unemployment benefits have served as a disincentive to settle for a job that pays the same or less, especially for workers at the lower end of the income scale. Twenty-six states have moved to halt these benefits before their early-September 2021 expiration. Beyond that, families, especially women, have been forced to forego paid work due to a lack of support for workers with children at home for remote learning. According to the US Bureau of Labour Statistics, the civilian labour-force participation rate for females aged 25 to 54, has fallen 1.9 percentage points since December 2019 to 75% as at 31 May. The comparable reading for males is 1.3 percentage points lower at 87.8%.
At SEI, we assume that the impediments and disincentives that have limited the supply of labour will ease considerably in the months ahead. A greater percentage of the population will be vaccinated, students will likely be physically back at school full-time in September and enhanced unemployment benefits will have expired. We will keep a close watch on the trends in labour compensation and productivity growth in judging how transitory inflation proves to be.
In his latest testimony, Fed Chairman Jerome Powell reiterated that the labour market still has a long way to go before it reaches full employment. Although FOMC members have finally started talking about tapering the Fed’s asset purchases, the central bank is expected to hold off from announcing anything official until late in the third quarter—with actual tapering beginning in the first quarter of 2022, at the earliest.
We expect the Fed to remain cautious when it comes to tightening the monetary reins. Although seven of the 18 Fed governors and regional presidents have pencilled in at least one policy-rate increase for 2022, we think such a move remains highly unlikely. To our surprise, markets reacted negatively to the central bank’s 16 June announcement about the FOMC’s updated “dot plot” of projections for the federal-funds rate. With this revision, the median FOMC projection now calls for two rate hikes in 2023—which was exactly what futures traders had already priced in prior to the mid-June announcement. Those same traders have now priced in three rate hikes by the end of 2023. While the Fed’s revised view of its timing for the first policy-rate increase is notable, it pays to remember that the actual increase is still far into the future. A lot can happen between now and the end of 2023.
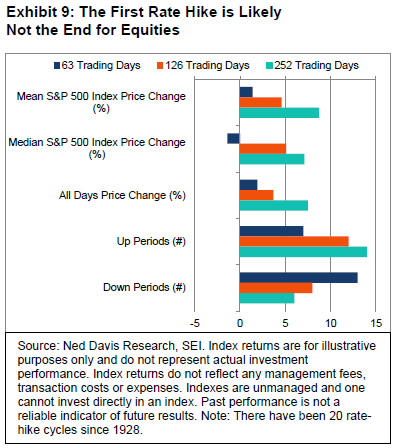
How will the equity market respond when the Fed does finally get around to raising its policy rate? It probably will still go up, if history is a guide. Exhibit 9 on the following page highlights the 20 occasions since 1928 when the Fed raised its policy rate (using the discount rate prior to 1987 and the federal-funds rate thereafter).
To date, the S&P 500 Index has managed to post a price-only gain over each 6- and 12-month period that followed a policy-rate hike exceeding the average historical increase. Of course, all rate cycles are unique, and investor sentiment can at times change dramatically. We only want to emphasize that equity bull markets can be resilient beasts. There may be a stumble when the US central bank begins a rate-tightening cycle, but it typically takes significantly more tightening to kill the beast.
At this point, the Fed is much more focused on the labour market than the inflation rate. It may begin to taper purchases of mortgage-backed securities next year, but there’s a good possibility the central bank will continue to buy Treasurys at the current pace at least until the economy is operating much closer to full employment. Between the Fed’s near-zero interest-rate policy and its Treasury purchases, there seems to be little chance that longer-term bond yields will provide a positive inflation-adjusted return anytime soon—even as the Federal deficit continues to expand at a pace that would have stoked bond-market worries in years past.
To repeat, there is a strong expectation among investors that inflation will fall back to the Fed’s 2% long-term target next year. There also is little concern that the fiscal measures being pushed by President Joe Biden’s administration will cause the US economy to overheat. Exhibit 10 highlights the Congressional Budget Office’s (CBO) projections of US federal government receipts and expenditures as a percentage of GDP over the next 10 years. The solid lines represent the CBO’s baseline projections, while the dotted lines reflect the Biden administration’s spending and tax proposals (including the infrastructure plan currently being negotiated).
Although government outlays as a percentage of GDP will decline as emergency COVID-19 relief provisions expire, they are expected to remain around a 24% share of the total US economy through the forecast period if Biden’s plan is passed in its entirety. That would match the high point briefly reached in 2009 following the global financial crisis, which included the worst recession in the post-World War II period prior to last year’s pandemic-related contraction. There is no recession forecast by the CBO between now and 2030. In other words, the federal government’s share of spending in the economy is forecast to rise on a permanent basis. On the revenue side, President Biden has proposed a sharp increase in taxes on corporations and high-income individuals, which would bring total receipts as a percentage of GDP up to 20%. The only time it reached these levels in recent history was in 2000, when economic activity was strong and the tech bubble helped to generate a temporary surge in capital gains. In that earlier period, soaring tax revenue and a cyclical decline in expenditures produced a rare surplus in the US government’s fiscal position.
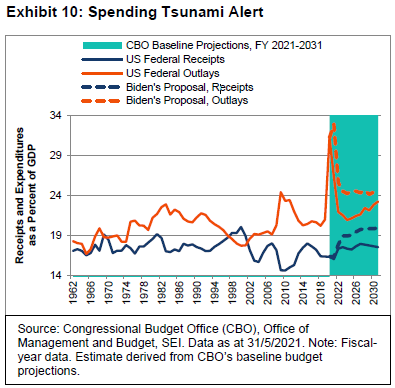
There is no surplus in sight, according to the CBO. Under the Biden plan, the deficit would average about 5% of GDP between 2023 and 2030 and could well end up being higher. Republicans may succeed in limiting tax increases, but the Democrats seem eager to push their spending priorities through the Senate’s reconciliation process on a party-line vote. It is possible, that spending will be limited at the insistence of one or two Democrats in the Senate. The future trend in fiscal policy should be much clearer before the end of September.
The combination of above-average economic growth; significantly higher inflation than seen in the past decade (let’s call it “persistently transitory”); a fiscal policy that expands the size of federal government spending as a proportion of GDP; and extreme monetary ease aimed at suppressing interest rates creates the perfect backdrop for risk assets—and for the birth of speculative bubbles.
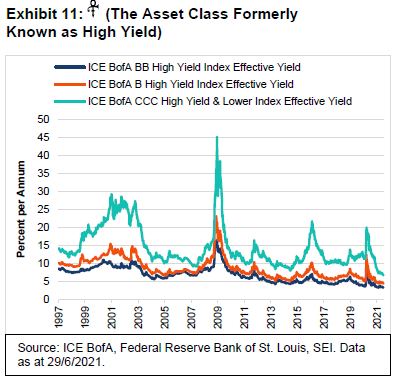
While not a bubble per se, we would note that even the riskier end of the fixed-income market has rallied to an extent that few would have ever imagined. Exhibit 11 shows that BB, B and CCC rated companies are all trading at their lowest yields ever. Yes, the fundamentals are incredibly good at the moment, but even the most hard-pressed companies in COVID-19-ravaged industries (cruise lines, hotels and airlines) have been able to refinance at low rates and extend the maturities on their debt. Yet it is unnerving to see the effective yield on BB rated debt at only 3.2%. Even more breathtaking is the 6.7% yield on speculative CCC securities. In April 2020, the effective yield touched 20%; at the height of the global financial crisis in 2008, the yield peaked at 45%.
GDP growth goes global
The relative success of the vaccination effort in the US along with the country’s federal system of governance giving individual states the freedom to pursue COVID-fighting restrictions to varying degrees—from extremely restrictive to no restrictions at all—have resulted in a significantly stronger economy in 2021 relative to other major developed countries.
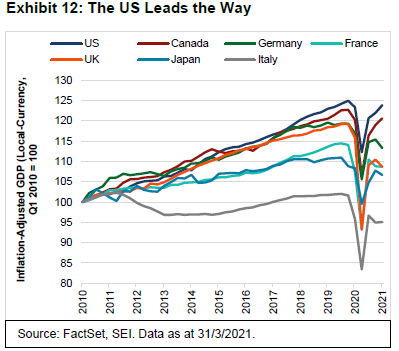
Exhibit 12 compares the path of inflation-adjusted GDP across a selection of major economies through the first quarter of 2021. In recent years, the US and Canada have pulled away from the next two best performers (Germany and the UK)—with the US having led the way since the end of 2019, followed by Canada and Japan. By March this year, US inflation-adjusted GDP was only 0.9% away from its December 2019 level. When all economic datasets are in for the second quarter of 2021, we expect overall business activity in the US to hit a new record high.
Meanwhile, Canada and Japan fell 1.7% and 2% short of their respective 2019 levels in the first quarter. France and Germany, by contrast, were down by 5%, while overall business activity in Italy and the UK were off by a substantial 6.4% and 8.7%, respectively, during the same period. Note that Japan and Europe contracted in the first quarter owing to their more restrictive lockdowns.
Fortunately, vaccinations are accelerating in Europe and Japan, and COVID-19-related lockdowns are becoming less restrictive. The Delta variant of the virus continues to challenge economic progress, but these countries are nevertheless expected to record solid increases in second-quarter GDP (albeit not as strong as the gain expected in the US). We anticipate that other advanced economies will record strong results in the second half of 2021 and into 2022, exceeding the US pace of growth. Canada and Japan should attain their previous peaks in real GDP later this year, while Germany and France will likely do so in the first half of 2022. While the UK and Italy are expected to take longer to reach their 2019 levels given their deeper recessions, both have the potential to enjoy sharper-than-average rebounds as the UK adjusts more fully to life after Brexit and Italy opens up to foreign tourism.
Although economists correctly point out that the US has employed direct fiscal measures (emergency spending, income support and tax breaks) more aggressively than elsewhere in the world, other countries have used different tactics including loans, equity infusions and various guarantees that far exceed the US fiscal effort. Exhibit 13 highlights the findings of the International Monetary Fund. Since the start of the pandemic response, the US has provided direct fiscal support amounting to over 20% of 2020 GDP. Australia, the UK, Japan and Canada have contributed the equivalent of roughly 15% to 16% of GDP. Most other countries lag far behind.
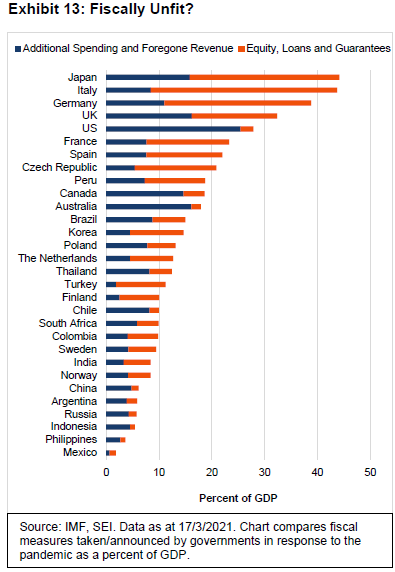
When one takes into account measures taken outside of direct fiscal support, the picture changes dramatically. Several European nations and Japan have relied on equity injections, loans and guarantees. The most notable are Italy (35% of GDP), Japan and Germany (both at 28%). In the eurozone, some of these loan commitments are only just beginning to flow. Italy and Spain are big beneficiaries of the eurozone’s €750 billion loans and grants that are part of the so-called NextGenerationEU program. The goal of the program itself is to fund research and innovation that helps Europe transition to a digital and greener economy, improve its healthcare and emergency preparedness, and reinforce initiatives that promote social and economic equality.
If anything good for Europe comes out the pandemic crisis, however, it is the realisation that an early return to economic austerity would have made matters much worse for the EU and eurozone. Policy makers remember all too well how the pressure to rein in deficits in the aftermath of the 2007-to-2009 global financial crisis led to the 2011-to-2013 sovereign debt crisis among the periphery countries of Europe. Even Germany has crossed the proverbial Rubicon, away from austerity and into a level of fiscal support (for both itself and the rest of Europe) that would have been unthinkable less than two years ago.
The same can be said for monetary policy. The European Central Bank (ECB) seems pretty dedicated in maintaining its pandemic-related monetary support at least through March 2022. It would not be a surprise if the current monetary support is extended beyond that time frame, even if there is likely resistance from Germany and a few other inflation-phobic countries. The ECB recently pledged to increase its purchases of sovereign debt as part of the Pandemic Emergency Purchase Program. Exhibit 14 tracks the security purchases conducted by the largest central banks.
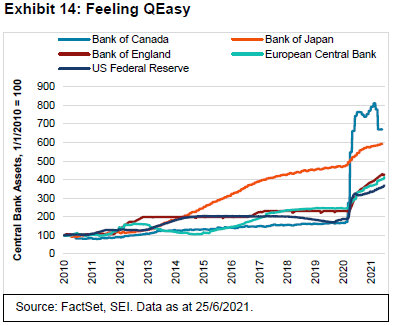
All in all, the ECB’s quantitative-easing program since the start of the pandemic seems mostly in line with the other central banks represented in the chart. The glaring exception is the Bank of Canada’s surge in purchases (from an exceptionally low base when measured against the size of its economy), although its bond portfolio has been pared significantly since February.
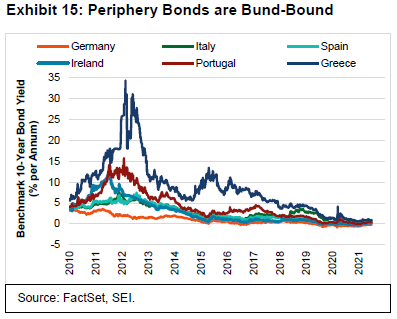
As a percentage of GDP, the ECB’s balance sheet has risen more than 25 percentage points since the beginning of the COVID-19 crisis. This compares with a rise in assets of 18 percentage points held by the US Fed; a 19 percentage-point expansion in the Bank of England’s gilt portfolio; an increase of 30 percentage points reported by the Bank of Japan (BOJ); and a 15 percentage-point gain for the Bank of Canada. Exhibit 15 shows how successful the ECB policy has been in conjunction with its pandemic fiscal support. The peripheral countries’ 10-year sovereign bond yields have stayed well-behaved through the crisis period, retreating sharply from the March 2020 panic highs. They now are well below the levels that prevailed at the start of 2019.
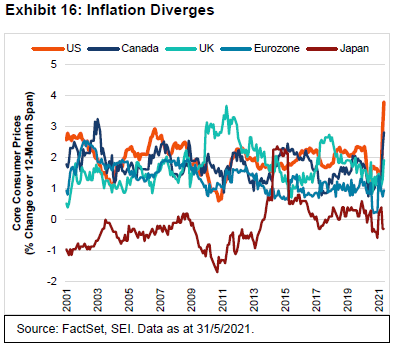
The world’s central banks are also singing from the same hymnal when it comes to inflation. Although consumer prices have accelerated in most of the countries/regions tracked in Exhibit 16, policymakers insist that it is a temporary event associated with the demand surge and supply-chain issues stemming from the re-opening of economies. While the US, the UK and Canada seem to be enduring a much sharper price rise than Japan or the eurozone, the latter two are probably relieved to have a respite from the deflationary pressures that have been afflicting their economies for many years. There seems little reason for the ECB or the BOJ to join the Fed when it comes to discussing a near-term reduction in their asset purchases, much less raising their policy rates ahead of the US.
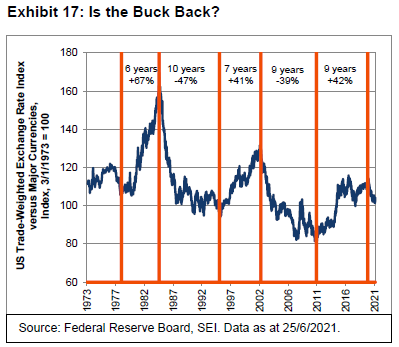
The trade-weighted US dollar jumped to its best level in three months against other major currencies in the days following the Fed’s June announcement—yet the currency remains some 10% below its 19 March 2020 high, as we highlight in Exhibit 17. Since any serious policy move by the Fed is still rather far into the future, we continue to expect the US dollar to gradually weaken as the rest of the world gains economic strength. Longer term, the country’s deteriorating balance of trade and fiscal position could add to the downward pressure.
In the meantime, we also do not see much sign that the Fed’s shift toward an earlier lift-off in rates is leading to a 2013-style “taper tantrum” among emerging economies. Exhibit 18 tracks the currencies of a selection of emerging economies.
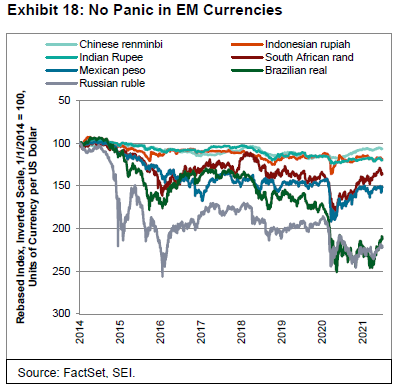
The Chinese renminbi, Indonesian rupiah, the Indian rupee, the Brazilian real and Russian ruble have all held firm against the US dollar. The South African rand and Mexican peso have taken harder hits, but both remain well above their early 2020 lows. Mexico, Brazil and Russia have already taken preventative measures, raising policy rates in June to support their currencies and put a dent in their domestic inflation rates (Hungary and the Czech Republic, not shown in the chart, are two other developing countries to raise their policy rate in June). Other countries are likely to follow.
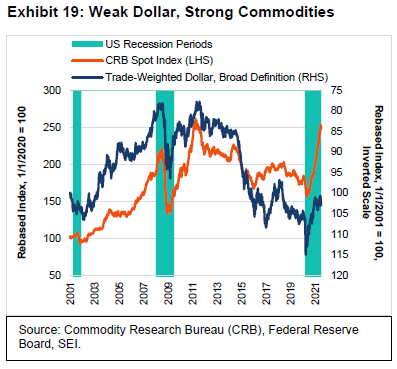
As Exhibit 19 shows, a strong US dollar (which is plotted on an inverted scale in the chart) would certainly threaten the bull market in commodity prices. At SEI, we remain bullish on the outlook for commodities but are still watching price trends carefully. Commodity prices of all types have enjoyed a spectacular run since March 2020; lumber, gold, aluminium and copper were already in the process of consolidating/correcting in the weeks before the Fed revised its views. Industrial metals prices have also been hurt by the Chinese government’s intention to release supplies of copper. Offsetting these negatives are the ongoing demand/supply imbalances throughout the world, particularly for petroleum.
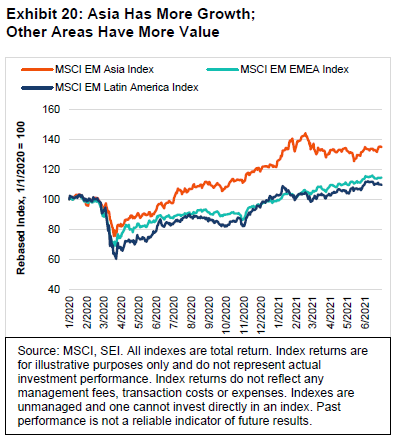
In previous reports, we highlighted how correlated both the US dollar and commodity-price trends are in relation to developing-economy stock markets. Exhibit 20 on the next page breaks down the MSCI Emerging Markets Index (total return) into its broad regional components and tracks their performance from the start of 2020. In that time, the Asia component has enjoyed a cumulative gain of 35%—yet has gone basically nowhere since the beginning of this year, just prior to the onset of the COVID-19 pandemic. The MSCI EM Asia Index trades like a growth stock, which is not surprising since China, Taiwan, South Korea and India account for 94% of its weighting and are each heavily skewed toward technology.
The other two components—MSCI EM Europe, Middle East and Africa (EMEA) Index (total return) and the MSCI EM Latin America Index (total return)—have performed much more in line with each other. Both fell sharply during the initial stages of the pandemic-related shutdown of the global economy, but have tended to outperform the MSCI EM Asia Index since November 2020. The EMEA and Latin America components are highly weighted toward financials, materials and energy, and have little exposure to less-cyclical, faster-growing sectors like technology, health care or communications. On a country-weighted basis, the MSCI EM EMEA Index is dominated by South Africa, Russia and Saudi Arabia (75% of its capitalisation), while the MSCI EM Latin America Index is dominated by Brazil and Mexico (a combined weight of nearly 90%).
We remain optimistic that the more cyclical and value-oriented sectors and geographies will bounce back from their modest stumble in June. But there are near-term challenges besides the shift in perceptions about US Fed policy and the future course of the US dollar and commodity prices. The strength of China’s economy is in question too. Exhibit 21 underscores the fact that credit growth in that country has decelerated significantly, similar to the slowdowns recorded in 2013 and 2018—when the performance of emerging markets was less than stellar.
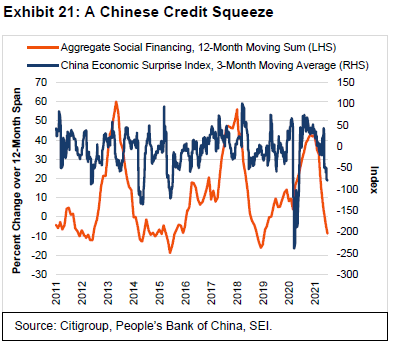
Economic surprises in China, meanwhile, have turned negative. We are counting on the advanced economies to take up the slack. As pointed out earlier, there is a tremendous amount of excess savings and pent-up demand in North America and Europe. Households and businesses have the wherewithal to spend lavishly through the rest of this year and into 2022, with the most important constraint being supply-chain issues and widespread shortages. As developing countries ramp up vaccination efforts, however, their economies should benefit from the surge in worldwide trading activity.
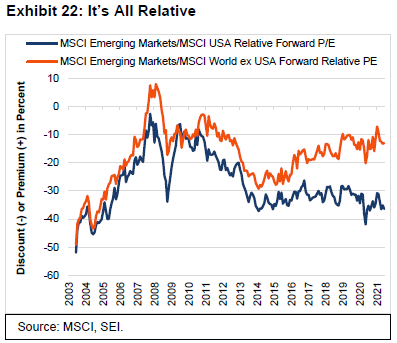
Emerging markets continue to look relatively cheap versus most other regions. Exhibit 22 shows that the forward price-to-earnings multiple of the MSCI Emerging Markets Index is still selling at a 36.4% discount to that of the MSCI USA Index as at 30 June. Outside of the March-to-April 2020 pandemic low point, this is as cheap a relative multiple against the US seen at any time in the past 16 years. The valuation disparity is not quite as wide against the rest of the developed world (represented by the MSCI World ex USA Index), but the estimated long-term forward earnings-per-share growth rate of the companies that make up the MSCI Emerging Markets Index tends to be five percentage points higher per annum than those in the MSCI World ex USA Index.
The things to watch
The last several weeks have witnessed a partial unwinding of the rotation trade that began in early September and was turbocharged by last November’s blockbuster news regarding the COVID-19 vaccines’ efficacy and safety results. So far, this appears to be a temporary pause in a longer-term upswing. At SEI, we contend that the global recovery and expansion have a long ways to go, especially since many countries are still restricting free movement and commerce to at least some degree.
The COVID-19 variants are obviously a matter of concern, but the vaccines still appear to be quite effective once people are fully inoculated. Fortunately, vaccine production is ramping up and initial distribution snafus are being ironed out in the developed countries. By the end of the third quarter, the majority of people in North America and Europe should be fully protected; the most vulnerable (older) age groups are close to being fully protected already. The challenge may be to convince younger people to get the vaccine. Even if herd immunity is not achieved, the rate of hospitalisations and deaths are likely to be much lower as a proportion of new cases. That said, as the northern hemisphere enters autumn and winter, the possibility of regional spikes in infections cannot be dismissed. If severe enough, markets could switch back to a decidedly risk-off position.
At SEI, we remain focused on the near-term positives when it comes to COVID-19. Slowing vaccination rates in the developed world mean more shots become available for the rest of the world. That is why we expect a rolling reopening of the global economy that extends well into 2022. This wave of recovery, though, could resemble an extended up-cycle that keeps the pressure on supply chains, leading to continued shortages of goods and labour. Investors’ faith in the “transitory inflation” narrative probably will be tested as we begin to wrap up the year and move into 2022.
The recent stumble in the rotation theme was exacerbated by the US Fed’s shift in expectations toward a sooner-than-forecast increase in the federal-funds rate. To some extent, the central bank’s changed outlook seems to represent nothing more than a communications problem. How can the Fed be more focused on actual outcomes than forecasts, yet provide guidance that is based on a prediction about future trends in economic growth and inflation a year or two from now? It is clear, however, that the Fed will begin to cautiously move away from its current policy stance. The first move will likely be the tapering of its bond-buying program, which may be announced at the end of August during the annual economic policy symposium in Jackson Hole, Wyoming.
The challenge of deciphering the path of US fiscal policy is made even harder by the lack of bipartisanship in Washington, D.C. and the narrowness of the Democratic majority in both houses of Congress, but especially the Senate. A traditional infrastructure bill is a good bet, but the push for non-traditional forms of infrastructure—and the taxes to pay for all the added spending—will depend on whether the Democrats in the Senate can come to terms with each other. Investors also need to brace themselves for another fight over the debt ceiling coming in the August-to-October time frame. Raising the ceiling has been less of an issue in recent years, but that will not be the case this year. Some readers might remember the battle over the debt ceiling in August 2011; at the time, the threat of default and the downgrading of the US government’s credit rating caused a steep decline in risk assets.
Internationally, central bankers in Canada and the UK are talking about tapering as well (the former country has already started to taper). The ECB is only at the talking-about-talking-about-it stage, but the debate in within the ECB could be fiercer than elsewhere given the divide between the rich inflation-phobic countries and the poorer countries that are more dependent on growth and government support.
Politics should also be lively in view of possible leadership changes that lay ahead. Germany will vote for a new Chancellor in September this year that will replace Angela Merkel, who has held the office since 2005. France begins its presidential election process in April 2022, with President Emmanuel Macron far less popular now than he was in 2017—perhaps giving an opening to candidates that are further to the left and the right on the political spectrum. Canada may also see a snap election before the end of this year, although one need not take place before the scheduled end of the legislature in October 2023.
Another potential source of market volatility could stem from China’s increasingly fraught relationship with the US and its allies. Global tensions over Hong Kong, human rights, and, most worryingly, Taiwan, could continue to spill over from the political sphere into the economic sphere. The tariff war waged by former US President Donald Trump yielded mixed results, at best. But if there is any consensus in Washington nowadays, it is focused on countering China’s growing economic and military strength. Investors have mostly managed to look past political tensions, so we do not want to over-emphasise the negatives. However, managing the relationship between the US and China could become a key consideration in future years.
What actions are our portfolio managers taking?
Within US large caps, there was no major change in positioning during the second quarter. Quality and value-oriented stocks were still viewed as trading at attractive prices. Managers do not expect runaway inflation, nor are they buying inflation hedges; they have been positioning for a full reopening of the US economy (which is correlated with the inflation trade). In terms of performance, it was a choppy quarter. While growth led, value did have a few good runs. There was some disciplined rebalancing as managers sorted through stocks that ran up too far during the recent rally. Managers favoured the financials, industrials and health care sectors. Mega-cap stocks were underweight, while large-caps were overweight.
In US small caps, higher-quality and low-volatility stocks were attractive from a valuation perspective during the second quarter. Managers favoured the financials and industrials sectors, while health care was out of favour. With two big meme stocks (GameStop and AMC) set to move out of small-cap indexes, volatility should decrease.
Within international equity markets, quality managers generally outperformed value and momentum managers for the three-month period ending June. Traditional defensive names were left behind in this pro-cyclical reflationary rally. We continued to make adjustments in support of our value tilt, with most changes having been around the edges; our portfolios modestly trimmed exposure to banks. Some managers have added to their materials allocations.
In Asia and emerging markets, performance was mixed for the second quarter as the resurgence of COVID-19 impacted many countries. Exporting nations saw favourable returns during the period, while domestic-oriented economies generally fared well. Taiwan, Vietnam and Korea all gained. Energy and telecommunications outperformed during the quarter, while small-cap stocks continued to beat large caps. High exposure to small-cap and frontier markets contributed to performance. We remain optimistic about the value trade. There were not many changes in terms of positioning during the period.
In global fixed-income markets, yields are still low, and we expect some headwinds for the time being. In this environment, we believe credit-sensitive assets have the potential to outperform. Within corporate credit, we have a preference for lower-quality and shorter-maturity issues, which limits our sensitivity to rates. Overall, we remain pro-cyclically positioned for the potential of a global reflationary environment.
The high-yield market was up for the quarter. Energy outperformed the broader market. The new-issuance market continued to be strong. Refinancing was still the key theme during the period. The default rate was close to 5.5%. We were overweight basic industry and underweight oil. There were no changes to target weights.
Emerging markets have been lagging developed markets. Managers view inflation as transitory and believe that base-effects will wear off. Short-term inflation could remain elevated. Hard currency and high yield continue to be attractive. We believe there is still room for growth, as many central banks have kept policy rates near or at all-time lows; even if central banks begin to tighten, policy rates will still be low enough to support growth.
Important Information
This material is not directed to any persons where (by reason of that person's nationality, residence or otherwise) the publication or availability of this material is prohibited. Persons in respect of whom such prohibitions apply must not rely on this information in any respect whatsoever. Investment in the funds or products that are described herein are available only to intended recipients and this communication must not be relied upon or acted upon by anyone who is not an intended recipient.
This material represents an assessment of the market environment at a specific point in time and is not intended to be a forecast of future events, or a guarantee of future results. While considerable care has been taken to ensure the information contained within this document is accurate and up-to-date, no warranty is given as to the accuracy or completeness of any information and no liability is accepted for any errors or omissions in such information or any action taken on the basis of this information.
SEI Investments (Europe) Limited (SIEL) acts as distributor of collective investment schemes which are authorised in Ireland pursuant to the UCITS regulations and which are collectively referred to as the “SEI Funds” in these materials. These umbrella funds are incorporated in Ireland as limited liability investment companies and are managed by SEI Investments Global Limited, an affiliate of the distributor. SEI Investments (Europe) Limited utilises the SEI Funds in its asset management programme to create asset allocation strategies for its clients. Any reference in this document to any SEI Funds should not be construed as a recommendation to buy or sell these securities or to engage in any related investment management services. Recipients of this information who intend to apply for shares in any SEI Fund are reminded that any such application must be made solely on the basis of the information contained in the Prospectus (which includes a schedule of fees and charges and maximum commission available). Commissions and incentives may be paid and if so, would be included in the overall costs.) A copy of the Prospectus can be obtained by contacting your Financial Advisor, SEI Relationship Manager or by using the contact details shown below.
Data refers to past performance. Past performance is not a reliable indicator of future results. Investments in SEI Funds are generally medium- to long-term investments. The value of an investment and any income from it can go down as well as up. Returns may increase or decrease as a result of currency fluctuations. Investors may get back less than the original amount invested. SEI Funds may use derivative instruments which may be used for hedging purposes and/or investment purposes. This material represents an assessment of the market environment at a specific point in time and is not intended to be a forecast of future events.
In addition to the usual risks associated with investing, the following risks may apply: Bonds and bond funds are subject to interest rate risk and will decline in value as interest rates rise. High-yield bonds involve greater risks of default or downgrade and are more volatile than investment-grade securities, due to the speculative nature of their investments. International investments may involve risk of capital loss from unfavourable fluctuation in currency values, from differences in generally accepted accounting principles or from economic or political instability in other nations. Emerging markets involve heightened risks related to the same factors as well as increased volatility and lower trading volume. Narrowly focused investments, securities focusing on a single country, and investments in smaller companies typically exhibit higher volatility.
The opinions and views in this commentary are of SIEL only and are subject to change. They should not be construed as investment advice.
This information is issued by SEI Investments (Europe) Limited (SIEL) 1st Floor, Alphabeta, 14-18 Finsbury Square, London EC2A 1BR, United Kingdom. SIEL is authorised and regulated by the Financial Conduct Authority (FRN 191713).
Issued in South Africa by SEI Investments (South Africa) (Pty) Ltd. FSP No. 13186 which is a financial services provider authorised and regulated by the Financial Sector Conduct Authority (FSCA). Registered office: 3 Melrose Boulevard, 1st Floor, Melrose Arch 2196, Johannesburg, South Africa.
A number of sub-funds of the SEI Global Master Fund plc and the SEI Global Investment Fund plc (the “SEI UCITS Funds”) have been approved for distribution in South Africa under s.65 of the Collective Investment Schemes Control Act 2002 as foreign collective investment schemes in securities. If you are unsure at any time as to whether or not a portfolio of SEI is approved by the Financial Sector Conduct Authority (“FSCA”) for distribution in South Africa, please consult the FSCA’s website (www.fsca.co.za).
Collective Investment Schemes (CIS) are generally medium to long term investments and investors may not get back the amount invested. The value of participatory interests or the investment may go down as well as up. SEI does not provide any guarantee either with respect to the capital or the return of an SEI UCITS Fund. The SEI UCITS Funds are traded at ruling prices and can engage in borrowing and scrip lending. A schedule of fees and charges and maximum commissions is available upon request from SEI. The SEI UCITS Funds invest in foreign securities. Please note that such investments may be accompanied by additional risks such as: potential constraints on liquidity and the repatriation of funds; macroeconomic, political/emerging markets, foreign currency risks, tax and settlement risks; and limits on the availability of market information.
For full details of all of the risks applicable to our funds, please refer to the fund’s Prospectus. Please contact your fund adviser (South Africa contact details provided above) for this information.
This commentary is intended for information purposes only and the information in it does not constitute financial advice as contemplated in terms of the Financial Advisory and Intermediary Services Act.
SEI sources data directly from FactSet, Lipper, and BlackRock unless otherwise stated.


