The Global Value-Stock Rally Turns 1: Can it Continue?
It’s been 12 months since “Pfizer Monday” (November 9, 2020, when Pfizer announced the development of the first successful COVID-19 vaccine). This date became the inflection point of value-oriented stocks’ return to favor versus growth amid a broad recovery rally.
How has the value rotation played out around the world?
Unevenly, to say the least. Exhibit 1 shows clear divides between U.S. and international stocks, as well as between more efficient market segments (like U.S. large caps and developed markets, which have more trading activity, higher liquidity, and better analyst coverage of companies and trends) versus less efficient segments (like U.S. small caps and emerging markets).
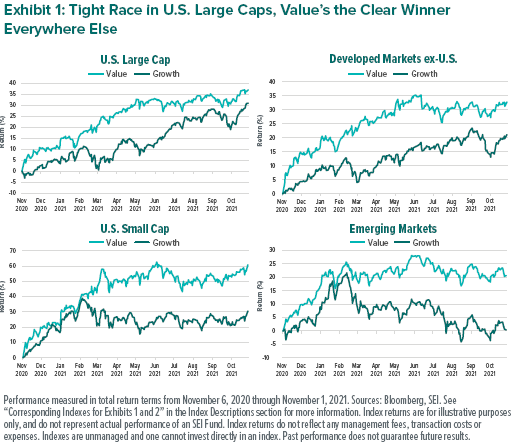
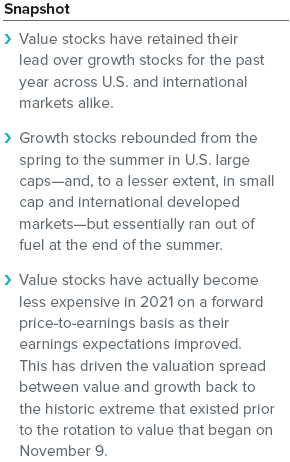
Value has retained the lead over growth for the full year across all segments—and has either continued to grow its lead, or is near its widest performance margin of the period, everywhere except in U.S. large caps.
Why?
Growth’s performance fell steeply in all four segments beginning in February. The pace of rising interest rates began to accelerate sharply during this period as economic growth prospects improved amid the earliest stages of reopening and expectations of higher inflation began to take hold.
Why did this weigh so heavily on growth stocks?
U.S. large-cap growth stocks are one of the most expensive areas of the stock market. When interest rates increase, the present value of future stock earnings—and stock valuations themselves—decrease. There’s more room for valuations to fall when stocks are expensive based on their projected future earnings growth.
So why did growth stocks rebound so sharply from the spring to the summer in U.S. large caps (and, to a lesser extent, in small-cap and international developed markets)?
The surging COVID-19 Delta wave halted, or at least slowed, the reopening theme that had ignited the growth-to-value rotation in the first place. Many of the expensive technology-oriented stay-at-home growth stocks regained their relative appeal as the prospects for a full and fast return to normal life came into question.
We can see that the growth rebound faltered at the end of the summer, precisely when the crest of the Delta wave started to come into focus across the developed world.
Emerging-market stocks had a different experience altogether after growth performance began to suffer in early 2021. Why?
Rising inflation commands greater urgency in emerging markets, but the response is the same: central banks raise interest rates to defend the value and pricing power of their national currencies. Emerging-market central banks have been increasing rates in 2021 to stay ahead of rising price pressures.
This contrasts sharply with the developed-market experience, where interest rates on government bonds declined significantly from early spring through mid-summer.
SEI’s view
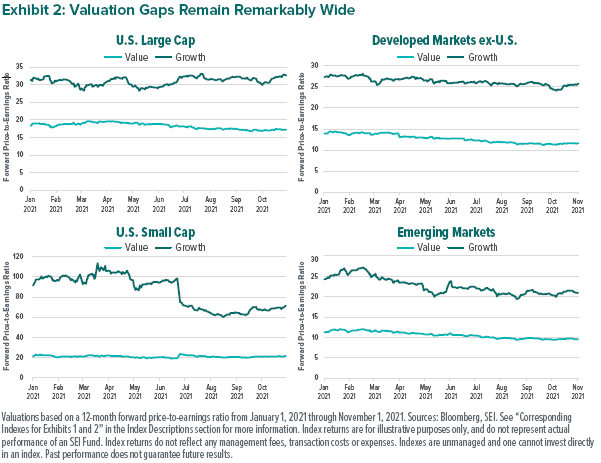
Valuations continue to tell the story. As Exhibit 2 shows, growth stocks remain much more expensive than value stocks. In fact, value stocks have actually become less expensive on a forward price-to-earnings basis as their earnings expectations improved alongside the reopening theme.
Coupled with growth’s summer rebound, the valuation spread between value and growth has been essentially driven back to the historic extreme that existed prior to the rotation. In short, value is still quite cheap in relative terms.
It’s been a good year for value, but we believe it still has a long way to go versus growth. Our U.S. large-cap strategies continue to underweight (compared to their benchmarks) many of the largest growth stocks in favor of more attractively valued opportunities further down the capitalization spectrum.
We also expect international stocks to improve their relative performance. Exhibit 2 paints a picture of the valuation discount on offer in the developed ex-U.S. segment, and emerging markets are even cheaper.
Won’t the greater rate hikes in emerging markets create challenges?
We believe investors are being paid to take the additional risk given the wide valuation gap. Recent outperformance by small caps and smaller Southeast Asian countries support our expectation that value will gain ground everywhere, not just in the U.S.
Glossary of Financial Terms
Growth: Growth stocks exhibit earnings growth above that of the broader market.
Price-to-earnings (PE) ratio: The PE ratio is equal to the market capitalization of a share or index divided by trailing (over the prior 12 months) or forward (forecasted over the next 12 months) earnings. The higher the PE ratio, the more the market is willing to pay for each dollar of annual earnings.
Value: Value stocks are those that are considered to be cheap and are trading for less than they are worth.
Index Descriptions
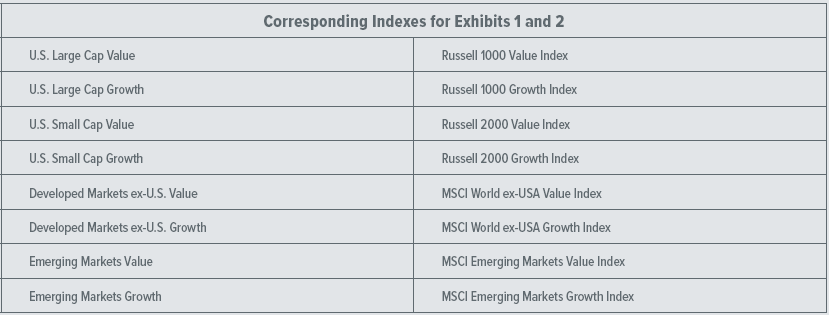
MSCI Emerging Markets Growth Index: The MSCI Emerging Markets Index is a free float-adjusted market-capitalization-weighted index designed to measure the performance of global emerging-market equities that exhibit overall growth style characteristics.
MSCI Emerging Markets Value Index: The MSCI Emerging Markets Index is a free float-adjusted market-capitalization-weighted index designed to measure the performance of global emerging-market equities that exhibit overall value style characteristics.
MSCI World ex-USA Growth Index: measures the equity market performance of large- and mid-cap securities exhibiting overall growth style characteristics across developed-market countries, excluding the U.S.
MSCI World ex-USA Value Index: measures the equity market performance of large- and mid-cap securities exhibiting overall value style characteristics across developed-market countries, excluding the U.S.
Russell 1000 Growth Index: The Russell 1000 Growth Index measures the performance of the large-cap growth segment of the U.S. equity universe. It includes those Russell 1000 Index companies with higher price-to-book ratios and higher forecasted growth values.
Russell 2000 Growth Index: The Russell 2000 Growth Index measures the performance of the small-cap growth segment of the U.S. equity universe. It includes those Russell 2000 Index companies with higher price-to-value ratios and higher forecasted growth values.
Russell 1000 Value Index: The Russell 1000 Value Index measures the performance of the large-cap value segment of the U.S. equity universe. It includes those Russell 1000 Index companies with lower price-to-book ratios and lower expected growth values.
Russell 2000 Value Index: The Russell 2000 Value Index measures the performance of small-cap value segment of the U.S. equity universe. It includes those Russell 2000 Index companies with lower price-to-book ratios and lower forecasted growth values.
Important Information
This material represents an assessment of the market environment at a specific point in time and is not intended to be a forecast of future events or a guarantee of future results. Positioning and holdings are subject to change. All information as of the date indicated. There are risks involved with investing, including possible loss of principal. This information should not be relied upon by the reader as research or investment advice, (unless you have otherwise separately entered into a written agreement with SEI for the provision of investment advice) nor should it be construed as a recommendation to purchase or sell a security. The reader should consult with their financial professional for more information.
Statements that are not factual in nature, including opinions, projections and estimates, assume certain economic conditions and industry developments and constitute only current opinions that are subject to change without notice. Nothing herein is intended to be a forecast of future events, or a guarantee of future results.
Certain economic and market information contained herein has been obtained from published sources prepared by other parties, which in certain cases have not been updated through the date hereof. While such sources are believed to be reliable, neither SEI nor its affiliates assumes any responsibility for the accuracy or completeness of such information and such information has not been independently verified by SEI.
There are risks involved with investing, including loss of principal. The value of an investment and any income from it can go down as well as up. Investors may get back less than the original amount invested. Returns may increase or decrease as a result of currency fluctuations. Past performance is not a reliable indicator of future results. Investment may not be suitable for everyone.
This material is not directed to any persons where (by reason of that person’s nationality, residence or otherwise) the publication or availability of this material is prohibited. Persons in respect of whom such prohibitions apply must not rely on this information in any respect whatsoever.
The information contained herein is for general and educational information purposes only and is not intended to constitute legal, tax, accounting, securities, research or investment advice regarding the strategies or any security in particular, nor an opinion regarding the appropriateness of any investment. This information should not be construed as a recommendation to purchase or sell a security, derivative or futures contract. You should not act or rely on the information contained herein without obtaining specific legal, tax, accounting and investment advice from an investment professional.
Information in the U.S. is provided by SEI Investments Management Corporation (SIMC), a wholly owned subsidiary of SEI Investments Company (SEI).
Information provided in Canada by SEI Investments Canada Company, the Manager of the SEI Funds in Canada.
Information issued in the UK by SEI Investments (Europe) Limited, 1st Floor, Alphabeta, 14-18 Finsbury Square, London EC2A 1BR which is authorised and regulated by the Financial Conduct Authority. Investments in SEI Funds are generally medium- to long-term investments.
The offer or invitation to subscribe for or purchase shares of the Sub-Funds (the “Shares), which is the subject of this Information Memorandum, is an exempt offer made only: (i) to “institutional investors” pursuant to Section 304 of the Securities and Futures Act, Chapter 289 of Singapore (the “Act”), (ii) to “relevant persons” pursuant to Section 305(1) of the Act, (iii) to persons who meet the requirements of an offer made pursuant to Section 305(2) of the Act, or (iv) pursuant to, and in accordance with the conditions of, other applicable exemption provisions of the Act.
SIEL has appointed SEI Investments (Asia) Limited (SEIAL) of Suite 904, The Hong Kong Club Building, 3 Jackson Road, Central, Hong Kong as the sub-distributor of the SEI UCITS funds. SEIAL is licensed for Type 4 and 9 regulated activities under the Securities and Futures Commission (“SFC”)
This information is being made available in Hong Kong by SEIAL. The contents of this document have not been reviewed by any regulatory authority in Hong Kong. You are advised to exercise caution in relation to the offer. If you are in any doubt about any of the contents of this document, you should obtain independent professional advice.
This information is made available in Latin America FOR PROFESSIONAL (non-retail) USE ONLY by SIEL.
Any questions you may have in relation to its contents should solely be directed to your Distributor. If you do not know who your Distributor is, then you cannot rely on any part of this document in any respect whatsoever.
Issued in South Africa by SEI Investments (South Africa) (Pty) Limited FSP No. 13186 which is a financial services provider authorised and regulated by the Financial Sector Conduct Authority (FSCA). Registered office: 3 Melrose Boulevard, 1st Floor, Melrose Arch 2196, Johannesburg, South Africa.


