Finding Gems in the Junkyard: Active Management in U.S. High-Yield Bonds
Exchange-traded funds (ETFs) continue to increase in popularity as the passive vehicles took in over $315 billion in 2018, marking the second best
year ever for ETF asset flows. Despite challenging market conditions, ETF assets under management ended 2018 at a rather robust $3.4 trillion (per
ETF.com, 2018’s $315B ETF Inflows 2nd Largest Ever, 3/1/19). Only about 31% of last year’s inflows went to fixed-income ETFs; the overwhelming
majority flowed into equity products. In terms of total ETF assets, just 19% were in fixed-income. One of the reasons for the equity versus fixed-ncome
disparity in ETFs is the relative ease and efficiency with which equity indexes can be replicated compared to the difficulty in even attempting to
replicate a fixed-income index.
High-Yield ETFs Haven’t Measured Up
Two of the most popular high-yield ETFs as measured by assets under management, SPDR® Bloomberg Barclays High Yield Bond ETF (Ticker:
JNK) and iShares iBoxx $ High Yield Corporate Bond ETF (Ticker:HYG), have struggled to perform in line with commonly used indexes such as the ICE BofAML US High Yield Constrained Index, which is a popular benchmark for actively managed high-yield bond funds. Further, with expenses of 0.40% (as of 31/10/18) and 0.49% (as of 29/6/18), respectively, neither ETF offers a true low-cost solution such as those available in equities.
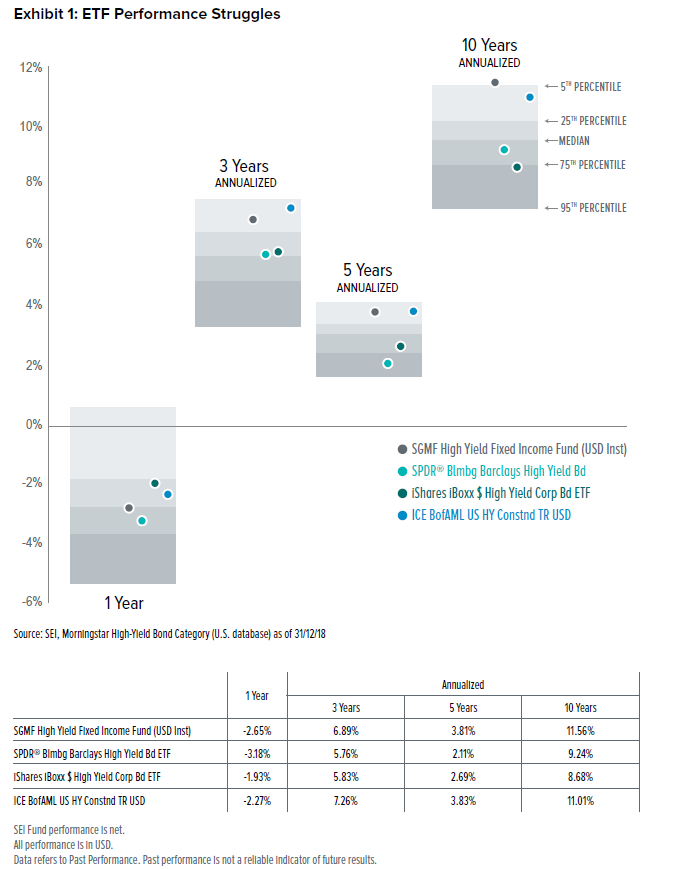
Admittedly, the index can often be a challenging reference point for actively managed funds as well. Especially in times of positive economic growth, highlighted by low default rates, investors can frequently observe smaller, less-liquid offerings that do not trade well (if at all) outperform and drive index returns higher. But there are also a number of times when issues or entire segments of the high-yield market are excluded from the index, and this is an area where active management can make a significant difference.
Moving Away From the Index
By definition, active managers must be different than the index; one way to do this is to hold securities that exhibit similar characteristics to the index but for any number of reasons are not included. Bank loans represent a compelling segment of the high-yield market that is not included in the ICE BofAML US High Yield Constrained Index. With their floating rates, bank loans have comparatively lower duration than comparable bonds and therefore are less sensitive to interest-rate changes – a particularly attractive feature in times of rising interest rates. Additionally, bank loans sit above bonds in the capital structure and typically carry ratings that are equivalent to BB rated bonds. This means they carry less interest-rate and credit risk than typical high-yield bonds. It’s not a “free lunch” however as investors must sacrifice some liquidity when compared to bonds, but we believe this tradeoff is worth the risk.
Collateralized loan obligations (CLOs) are another area of interest for SEI. These structured investments offer the potential for excess returns, though as with bank loans, they are often less liquid than traditional high-yield bonds.
The Outlook Remains Positive
Default rates among high-yield bonds have been below historical averages and we expect them to continue trending lower into early 2019. Yields meanwhile are more attractive than earlier in the year, the ICE BofAML US High Yield Constrained Index sports a yield to maturity of 7.98% as of 31/12/18 (source: BlackRock). High-yield issuers continue to be able to refinance and there is strong demand to cover new issuance. Meanwhile,
yield spreads remain attractive relative to investment-grade bonds. Federal Reserve rate hikes are a persistent headwind, but Chairman Powell has indicated the pace of possible future hikes may be slowing. Meanwhile, with both fundamentals (low defaults, attractive yields) and technicals (refinancing, new issuance) appearing on solid footing, the highyield bond market seems poised for gains.
Performance shown is net of the Fund’s operating expenses. Performance does not reflect management fees payable to SEI and any advisory fees that may be payable to the dealer. The rate of return shown is used only to illustrate the effects of the compound growth rate and is not intended to reflect future values of the Fund or returns on investment.
Important Information
Investments in SEI Funds are generally medium- to long-term investments. The value of an investment and any income from it can go down as well as up. Investors may get back less than the original amount invested. Returns may increase or decrease as a result of currency fluctuations. Additionally, this investment may not be suitable for everyone. If you should have any doubt whether it is suitable for you, you should obtain expert advice.
No offer of any security is made hereby. Recipients of this information who intend to apply for shares in any SEI Fund are reminded that any such application may be made solely on the basis of the information contained in the Prospectus. This material represents an assessment of the market environment at a specific point in time and is not intended to be a forecast of future events, or a guarantee of future results. This information should not be relied upon by the reader as research or investment advice regarding the funds or any stock in particular, nor should it be construed as a recommendation to purchase or sell a security, including futures contracts.
In addition to the normal risks associated with equity investing, international investments may involve risk of capital loss from unfavourable fluctuation in currency values, from differences in generally accepted accounting principles or from economic or political instability in other nations. Bonds and bond funds are subject to interest rate risk and will decline in value as interest rates rise. High yield bonds involve greater risks of default or downgrade and are more volatile than investment grade securities, due to the speculative nature of their investments. Narrowly focused investments and smaller companies typically exhibit higher volatility. SEI Funds may use derivative instruments such as futures, forwards, options, swaps, contracts for differences, credit derivatives, caps, floors and currency forward contracts. These instruments may be used for hedging purposes and/or investment purposes.
While considerable care has been taken to ensure the information contained within this document is accurate and up-to-date, no warranty is given as to the accuracy or completeness of any information and no liability is accepted for any errors or omissions in such information or any action taken on the basis of this information.
The views and opinions shown in this commentary are of SEI only and should not be construed as investment advice.
This information is issued by SEI Investments (Europe) Limited, 1st Floor, Alphabeta, 14-18 Finsbury Square, London EC2A 1BR which is authorised and regulated by the Financial Conduct Authority. Please refer to our latest Full Prospectus (which includes information in relation to the use of derivatives and the risks associated with the use of derivative instruments), Key Investor Information Documents and latest Annual or Semi-Annual Reports for more information on our funds. This information can be obtained by contacting your Financial Adviser or using the contact details shown above.
SEI sources data directly from FactSet, Lipper, and BlackRock, unless otherwise stated. There are material differences between the investments discussed here including:
›› The SGMF High Yield Fixed Income Fund seeks to provide total return.
›› The SPDR Bloomberg Barclays High Yield Bond ETF seeks to provide investment results that, before fees and expenses, correspond generally to the price and yield performance of an index that tracks the U.S. high yield corporate bond market.
›› The iShares iBoxx $ High Yield Corporate Bond ETF seeks to track the investment results of an index composed of U.S. dollar-denominated, high yield corporate bonds.
Liquidity: while the SGMF High Yield Fixed Income Fund offers daily liquidity, liquidity for the ETFs listed here depends on market activity.
For a comprehensive discussion of each investment’s characteristics, please read the relevant prospectus.
Investment comparisons are for illustrative purposes only and not meant to be all-inclusive. To better understand the similarities and differences between investments, including investment objectives, risks, fees, and expenses, it is important to read the products’ prospectuses. Funds in the same category may have different holdings, risks and performance. Competitors may have more than one fund in the category. The competitor funds shown here were selected because they are two popular ETFs based on assets under management.


