Economic Outlook: Markets Stop, Drop, Roll…And Rebound
If you can keep your head when all about you are losing theirs…it’s probably time to buy! Our apologies to Rudyard Kipling, but the opening lines of his poem “If” come to mind when reviewing the wild gyrations of the financial and commodity markets during the past quarter. Equities, the riskier end of fixed income and commodities have all registered stunning round trips in terms of performance during the past quarter, plunging but then recovering. The worst thing an investor could have done is panic and take risk out of the portfolio at mid-quarter.
The dramatic slide in equity-market performance during the first part of the quarter actually was part of a much longer price correction that has proceeded in two phases, as Exhibit 1 shows.
Exhibit 1: When U.S. Equities Sneezed, the Rest of the World Caught Pneumonia
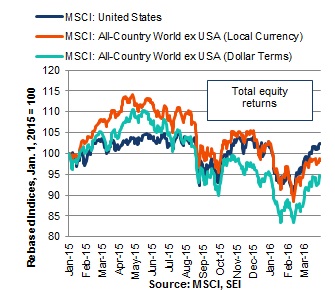
The first began nearly a year ago, in April and May 2015. Following a sharp rally during the opening months of 2015, non-U.S. equities began to give way. This weakness was coincident with the Greek debt crisis last spring and also came amid generally disappointing global economic growth. The first phase of the decline culminated last August amid the turmoil caused by the surprise depreciation of China’s currency. During the recovery phase of September and October, the MSCI U.S. Index outperformed the MSCI All-Country World ex-U.S. measured in local as well as U.S.-dollar terms. This recovery topped out in early December – a surprising development from our point of view, given the seasonal strength that tends to prevail toward year-end.
Unfortunately, the bloodletting gathered strength in the opening days of 2016 as investors fretted that another global recession was rearing its ugly head. The perennial bugaboo of Chinese debt levels and the country’s financial stability also was wheeled out as an explanation for the sell-off. Even the collapse of oil and other commodity prices was viewed as a negative force not only in commodity-producing nations but in consuming nations as well. Although we thought these various concerns were exaggerated, the MSCI All-Country World ex-U.S. index (total return) nevertheless sunk into bear-market territory by mid-February, registering a peak-to-trough decline of 22% in local-currency terms and 24.5% in dollar terms from the April 2015 high. The magnitude of the drop in U.S. equities wasn’t quite as harsh – down 14% from the July 2015 peak – but it nonetheless represented the worst correction since 2011. Since then, equity markets have rebounded by more than 10%, leaving the MSCI U.S. and the All-Country World ex-U.S. indexes close to their beginning-of-the-year levels in local-currency terms.
In fixed income, a similar risk-off/risk-on pattern occurred. As Exhibit 2 illustrates, there was an exceptionally sharp rise in yields and spreads for both high-yield and emerging-market securities since the middle of last year. Yields reached levels comparable to their 2011 peaks. Fortunately, the damage is nowhere near the extent recorded during the global financial crisis of 2008. Since mid-February, there has been a remarkable recovery that has brought yields back down to their beginning-of-the-year levels, implying a positive total-return experience for those holders who simply closed their eyes and endured the quarter’s rollercoaster ride.
Exhibit 2: OAS* Sends Out an SOS
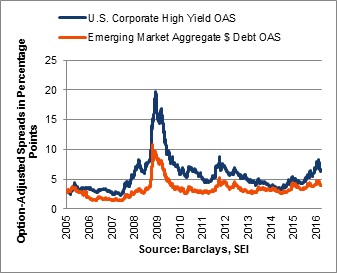
Option-adjusted spreads estimate the difference in yield between a security or collection of securities and comparable Treasurys after removing the effects of any special features, such as provisions that allow an issuer to call a security before maturity. It should be no surprise that developed-country government bond yields have traced a very different path versus riskier assets. In addition to the risk-off mind set of investors, government bond markets have been driven by the collapse in inflation expectations and the manipulation of various markets by central banks through their quantitative easing efforts. Although benchmark 10-year bond yields have firmed recently in response to the recovery in riskier assets, they mostly remain lower than at the start of the year. Ten-year Japanese government bonds (JGBs) have even dipped into negative territory. U.S. and U.K. bond rates are still very close to their all-time multi-century lows.
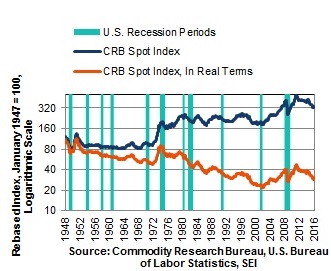
The rollercoaster has been even wilder for commodities. Oil prices, as measured by the West Texas Intermediate benchmark, dived from $37 at the end of last year to a low of $26 by February 11. At quarter-end, the price was close to $40. The Commodity Research Bureau’s index of spot prices, including raw industrials and foodstuffs but no oil, has climbed more than 5% in the year to date. Of course, the recent “strength” we are seeing in commodity pricing should be kept in context. The price of non-oil commodities has fallen steadily for almost five years, resulting in a 33% correction. Crude oil is down by two-thirds inside of two years. Exhibit 3 provides a longer-term perspective, in both nominal terms and adjusted for Consumer Price Index inflation. In inflation-adjusted terms, commodities are even cheaper now than they were in 1986, a time when oil was trading below $14 per barrel and the Commodity Research Bureau Spot Index (CRB) had reached a new post-World War II low.
Exhibit 3: Commodities Stumble
Now What?
The rally in risk assets since mid-February was probably more surprising to investors than the prior weakness. Market observers are sceptical that this upswing will continue. Certainly, there are good reasons to view the glass as half empty. Global growth remains less than stellar, although the fear of a U.S. recession within the next year or two has been tempered quite a bit. Unfortunately, government economic policy in both advanced and emerging economies is hamstrung by partisan politics and widespread sovereign and corporate over-indebtedness. It has been nearly impossible for countries to mount an aggressive fiscal response or implement the labour, product-market and tax reforms that could enhance growth in the longer run.
Most worrisome, monetary policy appears to be losing its effectiveness as a tool against the deflationary pressures that are especially concerning in Europe and Japan. When you toss in the increasingly contentious political environment found in the U.S. and several other advanced and emerging countries, it is easy to understand why market strategists are still rather cautious.
Some widely-followed economic indicators obviously support this pessimistic view. With the exception of Europe, the OECD’s Leading Economic Indicators Index for several advanced countries has sunk into slowdown territory (although nowhere near the extreme recessionary levels in 2008 and 2009). Keep in mind, however, that some of the components that go into the index – share prices, business and consumer confidence and interest-rate spreads – are, by their nature, based on expectations that can and do change frequently. As animal spirits shift in response to new data, so do these components. The sharp deterioration in financial-market conditions in the form of rising interest-rate spreads, negative interest rates and increasing correlations among different asset classes fed the widespread fear of a looming recession. Although we have consistently held that the recent turmoil in the markets is more akin to 2011 than the global financial and economic crisis of 2008, recession fears nevertheless hit a fever pitch by mid-quarter.
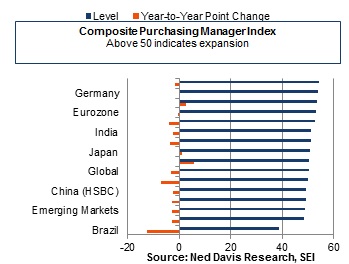
We think too much emphasis has been placed on the weaknesses of the global economy, while the brighter spots have been mostly ignored. For example, we find that investors obsess over the purchasing manager index (PMI) report at the beginning of each month; however, while manufacturing PMIs have been notably weak, the composite reports (including non-manufacturing and services) have strengthened considerably, at least in most advanced economies. As Exhibit 4 details, most major countries remain in an expansion phase despite sustaining a growth scare over the past year. The main areas of concern can be found in emerging markets, especially in commodity-producing countries (e.g. Brazil, South Africa).
Exhibit 4: Weaker But Not Terribly Weak
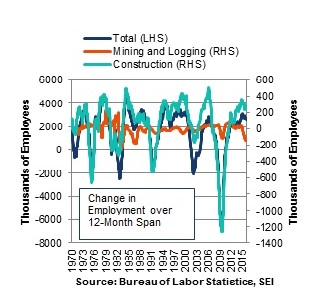
On a sector basis, it’s obvious energy and materials have been the primary drag. But it’s a mistake to assume that a contraction in these industries will lead to a downturn in an advanced, service-based economy. There is no pell-mell rush into global recession. Exhibit 5 highlights the cyclicality of employment in the United States, showing the actual number of jobs created or destroyed over a 12-month span. While it certainly looks as if the boom in shale oil production is turning into a bust, the rising number of layoffs in the mining and logging category (which includes the oil industry) has been nearly offset by the improving trend in the construction trades as housing activity comes back to life. Total non-farm payrolls, meanwhile, appear to be growing near the upper end of the historical range.
Exhibit 5: All’s Well in Total Employment,
Even Though Oil’s Not Well
The bottom line: We continue to believe that global economic growth will grind its way higher, led by the advanced and commodity-consuming emerging economies. The latter includes India and China. Although China’s debt is a lingering concern, it is more likely to constrain the pace of the country’s future growth than deteriorate into a 2008-like global catastrophe. Keep in mind that the bulk of China’s debt is owed by state-owned enterprises (SOEs) to quasi-state-owned banks. Only a small fraction of total debt is held by foreign investors. This low exposure to Chinese obligations should limit the prospects of the type of contagion that infected the global financial system after Lehman Brothers crashed. The central government’s debt ratio, moreover, is rather low. Households are not highly leveraged either.
The corporate sector in China is the big problem, both in terms of the growth of debt over the past six years and the size of the debt in relation to GDP. If the Chinese financial system is threatened by its corporate debt burden, however, the People’s Bank of China (PBoC) will likely ride to the rescue. In the worst-case scenario, the PBoC can assume the debt on its own balance sheet, much like the Fed and other governments’ central banks and Treasury departments engaged in bail-out operations during the 2008 housing crisis. Those loans either will be written off over time or (less plausibly) can be warehoused until they regain value as people move into the “ghost cities” and begin to use the infrastructure financed by many of these loans.
China does have experience clearing the decks. During the mid-to-late 1990s, the SOEs underwent wrenching structural reforms, firing tens of millions of employees and leaving a serious debt problem in its wake. The end result was an economy placed on much sounder footing and prepared for entry into the World Trade Organization in 2001. These painful reforms paved the way for the economic boom of the early 2000s. Granted, much has changed since the mid-1990s. China is now a major force in the global economy and accounts for more than 15% of world GDP, which is roughly equivalent to the United States in terms of purchasing power parity. Even more impressively, it accounts for 40% of total growth in world GDP. If the country’s economy continues to slow under the pressure of its debt burden, the recovery in commodity pricing and emerging-economy financial markets could well be stunted for years to come.
Investors Say “No” to NIRP
One of our bedrock macroeconomic assumptions has been that the world will avoid a generalized recession, managing to muddle through as has been the case since 2009. This does not mean that we will not see regional and country recessions and widespread growth scares.
Another bedrock assumption of ours is the conviction that central-bank monetary policy will remain highly expansionary on a global basis. Even in the U.S., where economic growth and inflation appear more entrenched than in most other countries, it is unlikely that interest rates will be pushed higher in an aggressive manner. Underscoring this view was the Fed’s most recent decision a few weeks ago to cut its own expectation for the path of the federal funds rate from four increases in 2016 to just two.
A more interesting question is whether central banks have reached the end of their policy effectiveness. This issue has come to the forefront of investor concerns in recent months as the Bank of Japan (BOJ), and then the European Central Bank (ECB), implemented radical policy prescriptions only to see markets react in an unexpectedly negative way. Both the yen and the euro have strengthened in response to actions that should have caused them to weaken. Equities in Japan and Europe have tended to weaken versus the U.S., even though one of the goals of unconventional monetary policy is to make riskier assets more attractive. In particular, bank stocks have been hit hard as interest rates have been pushed into negative territory. Although a secular bear market in major bank stocks has been in place since 2007 (Canadian banks being the notable exception), the sector has suffered an intensified decline in the past few years as short-term interest rates collapsed toward zero and into negative territory.
Investors naturally worry about narrowing profit margins, since interest rates paid to depositors tend to be sticky and will not likely turn negative, even as lending rates are pressured ever lower. In addition, there is increasing concern that non-performing loans on the balance sheets of the major banks will soar as a diverse portfolio of lending mistakes (to emerging-market borrowers, U.S. shale producers, small- and-medium-sized enterprises in the European periphery, etc.) comes home to roost. Finally, banks’ longer-term structural growth rates have been impaired owing to regulations such as Dodd-Frank that have forced them to exit certain businesses, reduce payments to shareholders and increase capital-to-asset ratios.
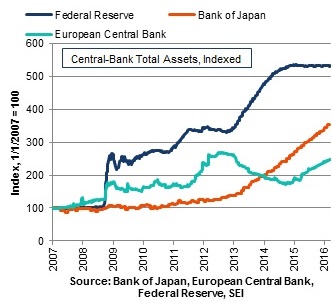
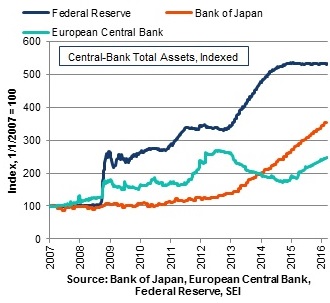
In his March 10 testimony, ECB President Mario Draghi conceded that interest rates can go only so low, an admission that sparked a stunning turnaround in the euro, from 1.08 to the dollar to 1.12, in what seemed to be the blink of an eye. But Draghi went on to say that central banks still have powerful tools other than interest rates at their disposal. These include increasing the amount of bonds that are bought every month, expanding the list of eligible collateral that can be purchased by the central bank and providing an attractive subsidy to banks in the form of Targeted Long-Term Refinancing Operations (TLTROs) to encourage lending. The ECB is employing all of these tools, in addition to negative rates, to encourage more lending to the private sector. The ECB’s balance sheet already has expanded by some €50 billion (34%) in the past year; the expansion over the next 12 months should be even larger (Exhibit 6). The reaction in the currency markets notwithstanding, it appears that the ECB’s actions, especially the revamped TLTROs programme, have been greeted with approval by shareholders in bank stocks. The rally in European banks that began in mid-February, for example, has gained significant strength post-meeting.
Exhibit 6: Easy Money
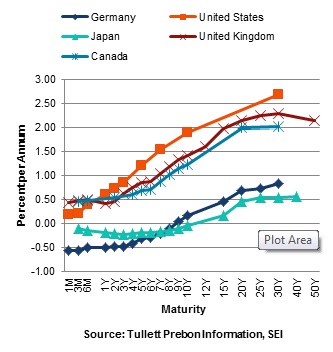
In both Germany and Japan, government bond yields now are negative out to 8 and 10 years, respectively (Exhibit 7). We still find it remarkable that there are willing holders (outside of the central banks or other government-controlled entities) for securities guaranteed to lose money each and every year for the next decade. If there is an overvalued asset in the world, it is a negative-yielding government bond. Of course, quantitative easing and negative interest rates are all about market manipulation. The more securities a central bank buys, the more depressed bond yields can become. However, the possibility that central-bank policy rates are as low as they are going to go probably means that yields at the short end of the curve are now firmly anchored near current levels. Long-term bonds conceivably could drift lower as quantitative easing programmes become more aggressive and soak up the remaining paper still lodged in private hands. Of course, this is just an updated version of the Greater Fool Theory. It would not take much of a yield rise to result in outsized investment losses. In late April last year, for example, the German 10-year bond yield fell to a low of 8 basis points; by early June, it was back to nearly 1%. That jump translated into a negative total return of almost 12.5%.
Exhibit 7: Central Banks Throw a Mean (Yield) Curve
As we mentioned above, Mario Draghi’s comment that short-term interest rates are not likely to decline any further lit an unexpected spark under the euro. The yen also has exhibited surprising strength, appreciating some 7% year to date against the dollar. The euro has appreciated 5%. The appreciation of both currencies is not just a recent phenomenon, however. Both the yen and the euro have gained against the greenback on a year-over-year basis.
This resilience runs counter to our own expectation that a widening interest-rate differential between the U.S. and those two countries would keep the greenback strong. Of course, part of the dollar’s weakness simply reflects the unwinding of traders’ positions. As we have noted often, being long the dollar has been a popular trade. Even if a strong dollar makes sense from a fundamental perspective, shifts in traders’ positioning can lead to the opposite outcome. In July 2012, for example, Mario Draghi promised, “Within our mandate, the ECB is ready to do whatever it takes to preserve the euro. And, believe me, it will be enough.” His words alone were enough to touch off a rally in the euro that lasted almost two years and drove the exchange rate from under 1.20 dollars per euro to nearly 1.40. In his recent press conference, Draghi was adamant that the ECB has the tools, the will and the ability to improve economic growth and stave off deflation without resorting to lower interest rates from this point. We think, however, the central bank will be hard-pressed to make good on that statement if the currency continues to appreciate.
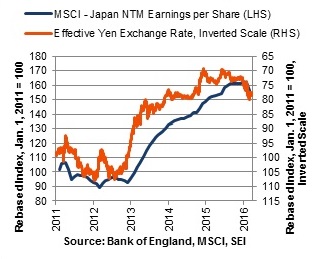
Despite the fact that the euro remains well below its peak levels, a combination of tepid regional growth, structural rigidities in labour and product markets and an unfavourable industry mix has kept corporate earnings growth in the eurozone unduly depressed. Forward 12-month earnings per share estimates for the companies that make up the MSCI EMU Index are no higher today than they were a year ago. If the euro were to strengthen significantly from here, the downward pressure on earnings would likely intensify. Japan provides a cautionary real-time example. The yen’s sharp depreciation ended in December 2014 on an effective (trade-weighted) basis and has appreciated about 10% since August alone. Analysts’ forward earnings estimates have begun to reflect this change in trend (Exhibit 8). Although Japanese earnings estimates are off only a modest 3.8% year-over-year, the inflection from the previous period of strong growth is notable; between 2013 and 2015, Japanese EPS growth was the most vibrant and consistent among the major advanced countries.
Exhibit 8: The Yen Bends the Earnings Curve
It’s not just the yen and the euro that have strengthened against the dollar in recent months. Several emerging-market currencies have posted surprisingly sharp gains too. The notable rally in the Brazilian currency has come despite the economic and political problems afflicting the country.
Sustained weakness of the dollar would have far-reaching consequences for global assets. For example, commodities as well as emerging-market debt and equity would benefit from it. Since hitting bottom during the third week of January, the MSCI Emerging Markets total return index has climbed 15% in local-currency terms and more than 21% when measured in U.S. dollars. On a year-to-date basis, the asset class is now in the black.
It’s hard to make a fundamental case for this dramatic turn in the fortunes of emerging market equities. Earnings per share have collapsed 30% since August 2014 in U.S. dollar terms, a performance that correlates closely with the bear market in commodity prices, as shown in Exhibit 9.
Exhibit 9: Submerging Profits in Emerging Markets
Data as at 29/2/2016
Like much of the rally in risk assets since mid-February, emerging market equities have benefited from a shift in investor sentiment and a general view that the sell-off to the downside was overdone. To be sure, there has been some good news flow lately – or at least some news that have been interpreted in a positive way. China has pushed through significant monetary and fiscal stimulus this year to ensure the economy can grow at a pace that will satisfy its population as it undergoes a broader economic restructuring. Brazil’s equity and debt markets have revived as the Petrobras scandal moves closer to President Dilma Rousseff, promising the possibility of a change in regime to one that is less corrupt, more technocratic and friendlier to markets. Even President Rousseff’s predecessor and mentor, Luis Inacio Lula da Silva, has become fully embroiled in the scandal, perhaps hastening the downfall of the current government. In similar fashion, political change in Argentina and Venezuela has touched off asset rallies that seem completely disconnected to the underlying economic fundamentals.
Whether or not the fundamentals catch up to this change of sentiment depends on a whole lot of things going right -- not just within these countries, but also on global basis. We’re sceptical. We need to see stronger global economic growth, improved trade flows and additional supply discipline from oil and other commodity producers. While the turn in commodity prices may augur a bottom in the long decline of earnings, the sharp improvement in investor sentiment has been the primary force behind the rally in emerging markets. That might be enough to keep the rally going in the short run, but it’s not enough for a sustained bull market.
Satisfying the Yearning for Earnings
At this point, we see better prospects for a durable earnings revival in the U.S. than elsewhere. As shown in Exhibit 10, analysts’ earnings expectations for the S&P 500 have been flat-lining around zero since the start of 2015.
Exhibit 10: Energy Is the Tail that Wags the S&P Dog
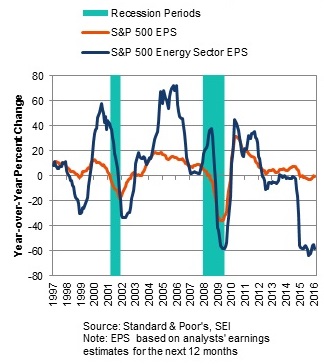
A collapse in earnings estimates for the energy sector, however, has depressed the total. Excluding energy, the earnings per share (EPS) estimates would be a bit above 4% year-over-year. That’s not great, but it seems more in keeping with the growth of U.S. business activity, as measured by nominal GDP. In addition, the stalling of the dollar’s appreciation against other currencies in the past year suggests that U.S.–based multinational corporations and import-sensitive industries should see some relief from negative currency translations and declining import prices. Exhibit 11 tracks the trade-weighted dollar against forward earnings per share on a year-over-year basis of companies found in the MSCI USA Index. We inverted the axis measuring the change in the currency to better show the relationship between the exchange rate and forward earnings. The correlation may not be super-tight (reflecting the fact that the U.S. is a relatively closed economy) but a negative relationship is certainly visible. As the currency depreciates, earnings increase.
Exhibit 11: Earnings Lost in Translation
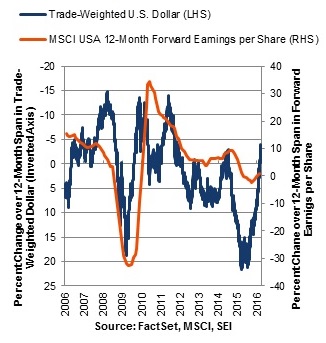
A large part of the earnings outperformance of the domestically-biased companies reflects the negative impact of the profits swoon in energy and materials. The dollar’s appreciation has also played a major role. As the U.S. currency’s strength fades and oil and other commodity prices stabilize, this performance disparity in earnings growth should narrow. In all, we think underlying earnings growth on a per-share in the U.S. will fall in the 5%-to-9% range over the next 12 months. We look for equity prices to appreciate in the same neighbourhood.
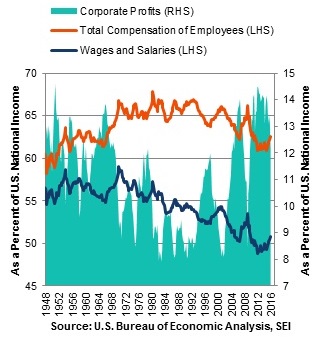
On an economy-wide basis, it’s worth noting that U.S. corporate profits as a share of national income remain near historically high levels. The share of profits, however, can be expected to contract as the economic cycle ages. We seem to have reached that stage, with labour’s share of income finally beginning to rise from levels that haven’t been seen since the 1950s (Exhibit 12). This erosion in profits margin eventually will become a headwind for the cyclical bull market in U.S. equities. Continued growth in the economy and accommodative monetary policy will, we believe, stave off the day of reckoning for another couple of years.
Exhibit 12: U.S. Labour’s Pains Have Been Capital’s Gains
If our no-recession forecast holds, the equity rally since mid-February should be able to build on itself. In Exhibit 14, we highlight previous occasions when the selling pressure in U.S. equities was as intense as it had become at the start of this year. We measure this selling pressure by the percentage of stocks trading above their 200-day moving average. The sharper and more prolonged the downward pressure on equities, the lower the percentage of stocks that trade above their 200-day MA. On January 21, less than 15% of S&P 500 equities were trading above their 200-day moving average, according to Ned Davis Research. A reading this low makes a rebound in equities seem probable. This 15% trigger was last reached during the sharp market correction of August 2011. The selling continued for a while longer in 2011, causing this indicator to fall all the way down to 9%. Still, as Exhibit 13 highlights, a decline below the 15% level in the absence of recession (1987, 1998, 2002 and 2011) has typically been associated with quite positive price-only performance over the following three-, six- and 12-month periods.
Exhibit 13: Buy When Others Sell
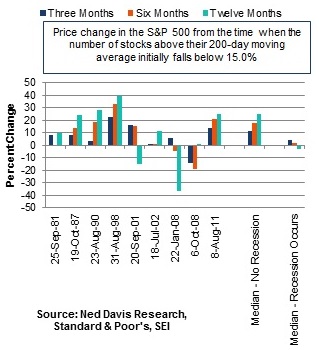
These intense corrections, of course, do not occur in a vacuum. The news flow is poor and fears of a recession are high. In 2011, for example, U.S. equities fell in response to the shutdown of the U.S. government and the breaching of the debt ceiling that raised the prospect of a technical default on Treasury securities. Outside the U.S., the peripheral debt crisis in Europe was heating up as Irish, Portuguese and Greek bond yields hit the mid-teens in July of that year. Thirteen years earlier, in August 1998, the selling pressure in equity markets was equally intense. At that time, investors were still reeling
from the Asian Contagion of 1997. Emerging-market equities had already fallen 40% in the previous 12 months in U.S. dollar terms. Commodity prices were in the tank and oil was trading near $10 a barrel. On August 13, 1998, Russia defaulted on its sovereign debt, devalued the ruble and declared a suspension of commercial banks payments to foreign creditors. The decline in stock prices intensified, pushing the percentage of S&P 500 stocks trading below their 200-day moving average below the 15% mark on August 31. The S&P 500 actually bottomed out in early October, just about two weeks after Long-Term Capital Management was rescued by its creditors. What did stocks do in response to all this drama? Between August 1998 and August 1999, the S&P 500 catapulted some 40% as the tech bubble gained full steam.
We’re not saying that we’re headed for a similar gain over the next year. No one needs another bubble that then pops. Rather, we simply want to underscore the fact that the selling in equities was probably overdone during the first six weeks of 2016. U.S. equities have already pushed 13% off their February lows and more volatile markets, including emerging-market equities and commodities, have climbed even more steeply over this period. On a fundamental basis, the economy looks relatively sound; even if the U.S. is merely the cleanest shirt in the laundry bag, we think there is potential for further equity-price gains as headline profitability improves.
We expect investors to continue to shift from a strong risk-off profile that has emphasized safety, stability and predictability to a more balanced investment stance. Around the time equities and other risky assets were hitting their lows. the analysts at Empirical Research Partners were highlighting how expensive safety and stability had become. Companies and sectors enjoying a high and steady return on equity, stable earnings growth, high earnings predictability, low financial leverage and a lower-than-average market beta had outperformed throughout much of the bull market cycle since 2009. By the end of January, this focus on stability and predictability had pushed companies sharing these characteristics well into the top decile of valuation, as measured by price to cash flow. This analysis is corroborated by SEI’s factor-based research, which we highlight in Exhibit 14.
Investors are paying the highest safety premium for low-beta, low-volatility stocks since the very end of the 2007-09 bear market. If investors judge that the recent rally truly reflects an improving economic environment, we think the shift toward risk-on behaviour has plenty of room to run.
A Lot of Bricks in the Wall of Worry
It has often been said that bull markets climb a wall of worry. The current wall looks steep. As we said above, the world economy remains extremely sluggish. There is no real conviction among market participants that the rally in emerging markets and commodities will prove long-lasting. Advanced countries are generally growing, but not quickly. Among emerging countries, Brazil, Russia, South Africa, Venezuela and other commodities exporters are dealing with recessionary conditions that are quite intense, rivalling the pain felt in 2008 or, in Brazil’s case, the 1930s. China, meanwhile, remains a conundrum. Although we lean toward the optimistic side, it is reasonable to question whether growth in that country truly is stabilizing or whether its debt bubble can be deflated in a controlled fashion.
Exhibit 14: Low Risk Is High Risk
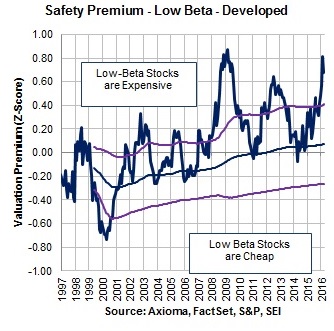
Center line=average
Lines above/below=+/-1 standard deviation
Valuation Spread Between 1st and 10th Quntilesof Axioma
Predicted Beta Measured by Axioma Value Factor.
Historical average and standard deviation (s.d) are calculated on a cumulative (“expanding window”) basis using the S&P Developed LargeMidCap Index.
Our conviction level is higher when it comes to continued economic expansion in the developed world. But there is only so much the U.S. or Germany or the United Kingdom can do to offset the inability of other countries to grow even at a modestly acceptable pace. Governments, both developed and developing, are hamstrung by excessive debt and an increasingly fractious political environment. As a result, a traditional Keynesian response (government spending) to the lack of aggregate demand has been a non-starter in most countries, even when there is an obvious need for infrastructure improvements and common sense fiscal and regulatory reforms.
Even more concerning is the sour mood of the electorate in the U.S., the United Kingdom and Europe following years of tepid growth, higher-than-necessary unemployment and extremely low wage growth. Populism is on the rise on the right and the left of the political spectrum, bringing with it anti-immigrant, anti-trade and anti-establishment feelings. In the U.S., Donald Trump has deftly tapped this vein of discontent. He has given voice to those who have not benefited from free-trade agreements and the economic order that accelerated the globalization trend and technology boom during the 1990s and the first decade of the 2000s.
In Britain, the referendum on the country’s continued membership in the European Union will be held on June 23. It appears as if it could be an uncomfortably close vote for those who think staying in the European Union is in the best economic interests of the country. Although the U.K. has been protected from the refugee crisis happening on the Continent, the chaos in the latter serves the purposes of the pro-Brexit forces (as do the attacks perpetrated by ISIS-inspired fanatics). The Brexit debate has shone a light on the fissures that exist within the ruling Conservative Party. Of course, the Labour Party’s problems run far deeper as it drifts further away from electability under Jeremy Corbyn.
And then there’s the refugee crisis on the Continent itself. As fences go up to impede the flow of people, the tensions between the periphery and the core have increased, while the political and economic divides within individual countries have worsened. As Charles Gave, a founder of the consultancy GaveKal, recently remarked, “Davos Man” (the term given to the globalized elite of politicians, central bankers, financiers and business people who meet in Davos, Switzerland every winter) is under attack as never before. The global financial crisis that occurred under its watch and the subsequent policy responses has benefited the Davos crowd more than anyone else. Although poor or incomplete data muddle the inequality debate, the unusually slow improvement in employment and wage income in many countries since the crisis cannot be denied. In the U.S., the benefits of expansion appear to extend downward a little more lately, but the angry political environment suggests this improvement is too little, too late.
Stronger growth is needed and needed fast. Unfortunately, the pressures to roll back the globalization tide through protectionism are intensifying. While we will not see the sort of trade measures put in place during the early years of the Great Depression, we wonder whether agreements like the recently-concluded Tran-Pacific Partnership (TPP) will be passed by the U.S. Congress in a lame-duck session following the November elections. The TPP without America as a full participant would be a much smaller and less-influential entity.
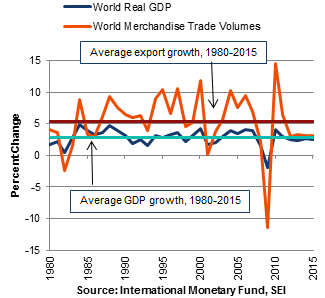
Exhibit 15 shows that the volume of trade has generally exceeded the growth of world GDP over the years. More recently, however, trade growth has slowed in line with world GDP. A move toward protectionism would only prolong this economic sluggishness. In the long run, this would represent a strong headwind for equities and other risk assets.
Exhibit 15: We Need More Trade, Not Less
Given these economic and political uncertainties, markets will continue to be difficult to navigate. We lean in a bullish direction, mainly because we are confident that the world economy will exhibit modest growth and that central banks around the world will do “whatever it takes” to coax their economies to grow and push inflation in an upward direction. Safety and stability still look expensive, as do government fixed-income securities. We like U.S. risk assets because the fundamentals seem better than most, although political dysfunction is an increasing worry. Meanwhile, the sharp recovery in emerging-market debt and equity and high-yield securities underscores the fact that beaten-down areas can come roaring back with little advance warning. Under these circumstances, diversification seems a better strategy than concentrated positions as trends shift back and forth in almost random fashion.
Strategy Positioning
Our equity investment managers have generally increased exposure to pro-cyclical stocks in the wake of declines that resulted in more attractive prices. Our fixed-income managers are also inclined to add risk, despite an expectation that heightened volatility could continue given concerns about central-bank activity, global growth and commodity prices.
U.S. equity strategies have initiated significant underweights to defensive managers. We see opportunities in deeper-value portfolios, which are trading around 10 to 11 times earnings, and we have maintained overweights to industrials and energy. Earnings are the key to a continued rally.
International developed-market positioning remains pro-cyclical and has not changed materially. From a sector perspective, an overweight to information technology and underweight to financials remain. Country-specific factors still dominate the emerging-markets space, but we believe the picture is improving there; valuations are cheap and attractive, and the odds of a move to the upside appear greater than the risk of a move to the downside. We are overweight Latin America, particularly Brazil, Peru and Mexico, with a smaller position in Argentina. Managers also see opportunities in China’s consumer discretionary and technology sectors, stemming from the transition to a consumer-driven economy.
Within global equity strategies, we also emphasize value at the expense of stability and, to a lesser extent, momentum. We are positioned to benefit from currency volatility, which is intended to partially offset the increased risk associated with exposure to value opportunities. The broader theme generally holds true in our Europe and U.K. strategies, with a preference for Italian banks in light of their attractive valuations and the ECB’s commitments to increased accommodation.
Positioning within an Asian equity strategy has shifted a bit; we added to real estate, industrials, medical technology and consumers, with an emphasis on the China market in the latter. Much like elsewhere, value and cyclical sectors are attractive, as they are trading at lows, while defensives remain expensive. Managers have become more bullish on Japan in anticipation of additional stimulus from Prime Minister Shinzo Abe ahead of the election, fuelling expectations that the yen will depreciate. Elsewhere, Hong Kong’s economy is softening as an anti-corruption campaign continues and consumer spending falls, and managers are avoiding Southeast Asian countries.
The U.S. core fixed-income strategy lightened their yield-curve flattening bias and reduced duration during the quarter as rates and the shape of the yield curve proved volatile. Managers are interested in marginally adding risk, particularly via exposure to new issuance, and might consider reducing credit quality if spreads remain wide. We have a modest overweight to industrials and higher-quality energy names specifically following the sector’s rally. We are also significantly overweight to banking, despite concerns about energy loans, banking viability and European financials. The managers like banks due to the regulatory tailwind, and while banks need to boost capital, they appear generally solid and their energy exposures appear manageable. Managers continue to like non-agency mortgage-backed securities, which have outperformed other spread assets amid recent challenges. Among asset-backed securities, managers have increased portfolio quality by reducing exposure to subprime auto loans.
Our global fixed-income strategies are positioned for a reflationary environment, with underweights to duration in Europe and Japan and overweights to emerging-market debt and select high-yield government bond markets, as well as corporate and securitized sectors. We have a slight U.S.-curve flattening hedge that offsets our general pro-risk positioning, and we expect to reduce the overweight to credit if spreads contract. Regionally, we have added to U.S. investment-grade at the expense of European investment-grade in an effort to capture comparably attractive yields. We anticipate managers will have more active foreign-exchange positions and we currently have underweight exposure to the euro, sterling and U.S. dollar.
Within high yield, managers have mostly held their positioning but reduced exposure to energy. From a credit-quality perspective, we continue to underweight BB rated issues, overweight CCC rated, and slightly overweight B rated. We remain underweight energy and basic industry (particularly metals and mining), have slightly increased bank loan exposure and modestly reduced our cash position.
The emerging-market debt strategy increased risk exposure in the first quarter, taking a 4% local-currency debt underweight to almost neutral weight. We retained exposure to corporates, which continued to look strong despite headlines. Regionally, we have added exposure to smaller, less-liquid countries that performed well in the recent recovery. We increased an overweight to Mexico and remain overweight Indonesia. Exposure to Russia is flat, but we have a slight overweight to ruble-denominated securities and we are underweight South Africa. Given the recent recovery and the fact that nothing is especially attractive from a valuation standpoint, we do not expect managers to continue adding risk.
Important Information
This material is not directed to any persons where (by reason of that person's nationality, residence or otherwise) the publication or availability of this material is prohibited. Persons in respect of whom such prohibitions apply must not rely on this information in any respect whatsoever. Investment in the funds or products that are described herein are available only to intended recipients and this communication must not be relied upon or acted upon by anyone who is not an intended recipient.
While considerable care has been taken to ensure the information contained within this document is accurate and up-to-date, no warranty is given as to the accuracy or completeness of any information and no liability is accepted for any errors or omissions in such information or any action taken on the basis of this information. Statements of future expectations, estimates, projections, and other forward-looking statements are based on available information and the author’s view as of the time of these statements. Accordingly, such statements are inherently speculative as they are based on assumptions which may involve known and unknown risks and uncertainties and are not guarantees of future outcomes.
SEI Investments (Europe) Limited acts as distributor of collective investment schemes which are authorised in Ireland pursuant to the UCITS regulations and which are collectively referred to as the “SEI Funds” in these materials. These umbrella funds are incorporated in Ireland as limited liability investment companies and are managed by SEI Investments Global, Limited, an affiliate of the distributor. SEI Investments (Europe) Limited utilises the SEI Funds in its asset management programme to create asset allocation strategies for its clients. Any reference in this document to any SEI Funds should not be construed as a recommendation to buy or sell these securities or to engage in any related investment management services. Recipients of this information who intend to apply for shares in any SEI Fund are reminded that any such application must be made solely on the basis of the information contained in the Prospectus (which includes a schedule of fees and charges and maximum commission available). Commissions and incentives may be paid and if so, would be included in the overall costs.) A copy of the Prospectus can be obtained by contacting your Financial Advisor, SEI Relationship Manager or by using the contact details shown below.
Past performance is not a guarantee of future performance. Investments in SEI Funds are generally medium to long term investments. The value of an investment and any income from it can go down as well as up. Fluctuations or movements in exchange rates may cause the value of underlying international investments to go up or down. Investors may not get back the original amount invested. SEI Funds may use derivative instruments which may be used for hedging purposes and/or investment purposes. This material represents an assessment of the market environment at a specific point in time and is not intended to be a forecast of future events.
In addition to the usual risks associated with investing, the following risks may apply: Bonds and bond funds are subject to interest rate risk and will decline in value as interest rates rise. High yield bonds involve greater risks of default or downgrade and are more volatile than investment grade securities, due to the speculative nature of their investments. International investments may involve risk of capital loss from unfavourable fluctuation in currency values, from differences in generally accepted accounting principles or from economic or political instability in other nations. Emerging markets involve heightened risks related to the same factors as well as increased volatility and lower trading volume. Narrowly focused investments, securities focusing on a single country, and investments in smaller companies typically exhibit higher volatility.
This information is issued by SEI Investments (Europe) Limited (“SIEL”) 1st Floor, Alphabeta, 14-18 Finsbury Square, London EC2A 1BR, United Kingdom. This document and its contents are directed only at persons who have been categorised by SIEL as a Professional Client for the purposes of the FCA Conduct of Business Sourcebook. SIEL is authorised and regulated by the Financial Conduct Authority.
This information is distributed by the following entities:
- SEI Investments (Middle East), which is a Dubai International Financial Centre trade name of SIEL which is regulated by the Dubai Financial Services Authority as a Representative Office.
- SEI Investments (Asia) Limited, Suite 904, The Hong Kong Club Building, 3 Jackson Road, Central, Hong Kong, which is licensed for Type 4 and 9 regulated activities under the Securities and Futures Ordinance ("SFO").
SEI sources data directly from Factset, Lipper, and BlackRock unless otherwise stated.
Important Notes:
No SEI Funds are authorised by the Securities and Futures Commission and such funds are therefore not available to retail investors in Hong Kong. The contents of this document have not been reviewed or endorsed by any regulatory authority in Hong Kong. You are advised to exercise caution in relation to the offer and if you are in any doubt about any of the contents of this document, you should obtain independent professional advice. This document does not constitute investment advice or an offer to sell, buy or a recommendation for securities.
The SEI Funds may not be offered or sold to the public in Argentina, Brazil, Chile, Colombia, Mexico, Peru, Venezuela or any other country in Central or South America. Accordingly, the offering of shares of the SEI Funds has not been submitted for approval in these jurisdictions. Documents relating to the SEI Funds (as well as information contained herein) may not be supplied to the general public for purposes of a public offering in the above jurisdictions or be used in connection with any offer or subscription for sale to the public in such jurisdictions.


