Economic Outlook: The Market Plot Takes a New Twist
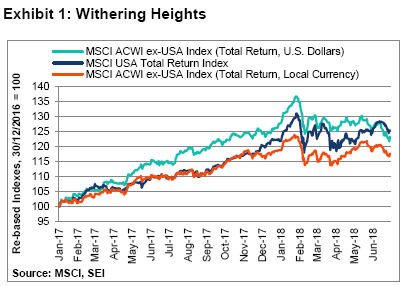
It might not be their darkest hour, but the year-to-date performance of equities around the globe certainly has been rough. The MSCI ACWI ex-USA Index (Net Total Return) is down 0.92% in 2018 through the end of June on a local-currency basis, and 3.46% when measured in US dollar terms. The MSCI USA Index (Net, Total Return), meanwhile, remains slightly positive, up 2.9% from its year-end 2017 level. As seen in Exhibit 1, the MSCI ACWI ex-USA and MSCI USA Indexes have followed similar patterns so far this year. Global equities generally enjoyed a strong start to the year in January, but lost those gains and more in early February. A rally sparked at the end of February faded in March. April and the first half of May saw another push to the upside—but that rally was followed by more downside volatility, as threats of trade wars and greater political uncertainty in several countries offset decent economic fundamentals. Although volatility has increased, the damage to a well-diversified equity portfolio has been limited. Even after five months of corrective activity, the accumulated gain over the past 18 months remains substantial.
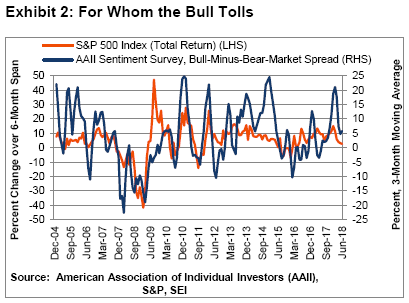
US investors and the professionals who advise them were raging bulls at the beginning of 2018 as equity prices vaulted higher. That optimism faded dramatically as the news flow turned less favourable. This diminution in investor spirits can be interpreted as a good thing; the potential for a meaningful advance in equities is greater when investors are pessimistic and bad news is already discounted in the price of riskier assets. To be sure, sentiment is not nearly as bleak as it was during 2015 (when oil prices were cratering and fears of global recession led by a possible implosion of Chinese debt were running high) or in 2011 (when there were worries that the US government might actually default on its debt and the European periphery debt crisis was heating up). Rather, we judge sentiment levels to be broadly neutral, consistent with expectations for stable-to-rising stock prices between now and the end of the year.
Exhibit 2 tracks US investor sentiment, as measured by the American Association of Individual Investors, and the six-month change in the S&P 500 Index (Total Return). If one believes, as we do at SEI, that the global economy is sound and the political uncertainties roiling markets will be contained, then the proper course (in our view) should be to maintain exposure to equities and other risk assets.
With that perspective in mind, we will examine the pressure points that have caused risk assets to stumble in 2018. Some are fundamental in nature. US monetary policy, for example, has shifted from a historically reflationary setting to something closer to neutral. Inflation in the US and elsewhere has ticked higher too, driven by synchronised global growth and a tightening of labour markets and industrial capacity in the US, Germany, the UK, China and in Asia generally. A jump in oil prices also is pushing headline consumer-price index readings to their highest levels in several years; the Organization of the Petroleum Exporting Countries and Russia have shown a fair degree of discipline in constraining the supply of crude oil at a time when demand is strong and inventory levels have fallen.
There are other worries that have the potential to negatively affect the global economy. The most important one, in our view, is the escalating trade tensions between the US and the rest of the world. Market participants also are being agitated by the political drama playing out in Italy; the prospect of rising US Treasury issuance and its negative impact on global liquidity; the messy evolution of the Brexit debate; and the notable deterioration in several emerging-market currencies and financial markets. These various and sundry concerns may or may not be quite as dire as they appear at the moment. But there’s no denying that the old adage “a bull market climbs a wall of worry” is being put to a severe test.
American Beauty
Over the past 12 months or so, we’ve taken the position that US equities will continue to perform well, and that markets outside the US should fare even better, based on an improving global growth profile and relatively attractive valuations. As Exhibit 1 shows, this position has not done well for us since late last year—reflecting the strong performance of technology and other growth sectors that dominate US stock-market capitalization versus the more muted performance of interest-rate-sensitive and value-oriented sectors that bulk larger in other developed markets. Over the twelve-month period, the MSCI Emerging Markets Index (Net) has held its own versus the MSCI USA Index (Net); although there has been a marked relative deterioration in recent months, especially in US dollar terms.
The sector composition of the US stock market is not the only factor behind its strong performance this year. The US economy has also continued to do better than most other countries and regions. Despite the overall improvement in global economic growth, activity in the US has been exceeding expectations since last October: this is represented above the zero line in Exhibit 3, as measured by Citigroup’s economic surprise indexes.
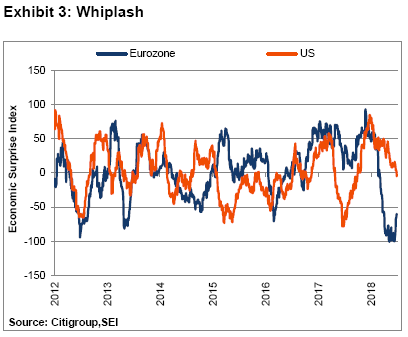
By contrast, the economic data in other developed- and emerging-market countries have tended to disappoint so far this year. This is especially so in the eurozone, where the Citigroup Economic Surprise Index has been bumping along its lowest readings in six years. It’s important to remember, though, that these economic surprise indexes tend to run in short cycles. The Citigroup Economic Surprise Index in the US already returned to a more neutral reading by the end of June, which means that economic data are now aligning more closely to survey expectations. Meanwhile, eurozone business activity continues to miss expectations by an unusually wide margin—yet its surprise index has started to rebound meaningfully off its year-to-date lows, suggesting that downside surprises in the region are fading. If this bounce is sustained, eurozone equity performance will likely be improved in the coming months.
Getting back to the US, its economy continues to advance at a steady pace—as measured by the Composite Index of Coincident Economic Indicators, a statistic that tracks four economic components, including the number of employees on non-agricultural payrolls; real (inflation-adjusted) personal income less transfer payments; industrial production; and real business sales. Exhibit 4 puts the US economic expansion into a broader historical context.
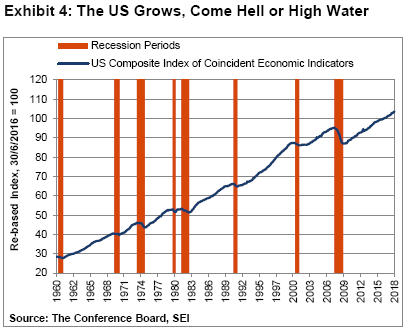
There is no sign that the tightening of US Federal Reserve (Fed) monetary policy over the past two-plus years has significantly impacted the upward trajectory of the US economy.
Interest-rate-sensitive sectors of the economy, notably housing, should be among the first to feel the impact of rising bond yields. But, thanks to demographics, we think the housing sector may prove more resilient to rising mortgage rates than one might otherwise expect. Exhibit 5 highlights existing and new-home sales versus the effective rate on a conventional 30-year mortgage in the US. Total sales remain exceedingly depressed nine years into the expansion, running almost 40% below the levels that prevailed from 2004 to 2005. We think this is well below the rate needed to satisfy demand.
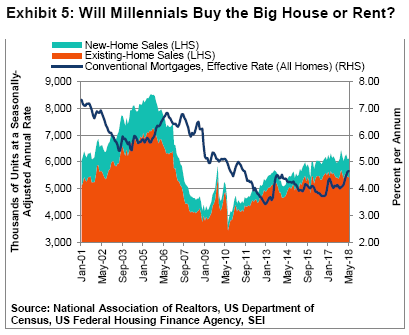
We expect demand for housing to at least hold its own against the backdrop of moderately rising rates. Millennials (generally defined as those born between 1981 and 2000) are starting families in greater numbers—a life change that usually necessitates moving from central-city districts to more-spacious, affordable housing in the suburbs.
If anything, it is the lack of inventory of homes for sale that is standing in the way of a more robust housing recovery. The absolute level of mortgage rates remains relatively low within the context of the past 10 years. Housing affordability, highlighted in Exhibit 6, underscores the fact that conditions are still favourable for buyers. An index of 100 means that a family with the median household income earns the exact amount required to qualify for the mortgage of a median-priced home.
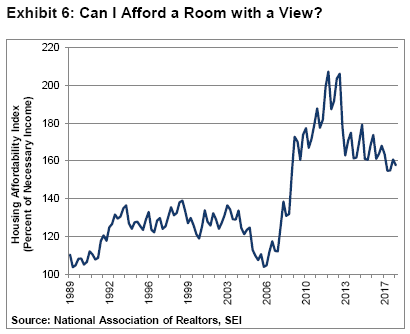
As of March 30 (the most recent available data), the US median family income is 57% greater than is needed to purchase the median-priced home. This is down sharply from a few years ago, when home prices were depressed and mortgage rates were at their trough. Still, affordability looks favourable compared to the 1990s and early-to-mid 2000s, when the median income was only 20% to 40% higher than the level required to afford a median-priced home.
Employment prospects and the expectation for income advancement are critical elements in the calculus to own a home rather than rent. Important progress has been made in that regard over the past few years. The employment-to-population ratio for young adults, ages 25 to 35, has increased from 75% in 2013 to 79% in 2018. Hourly wage growth also appears to be accelerating. According to Census Bureau data, real hourly wages for the bottom six deciles of the income distribution scale have mostly risen in the 2%-to-4% per-annum range between 2015 and 2017. As seen in Exhibit 7, that outcome is comparable to, or above, the real wage gains recently achieved by the higher-income groups.
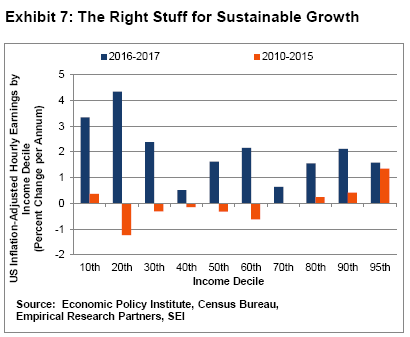
By contrast, real wages for the bottom six deciles fell during the 2010-to-2015 period, even as the higher-income groups enjoyed modest increases. The underlying point of this extended discussion: millennials are entering the phase of their lives when earnings growth tends to be strongest, just as baby boomers (those born in the US between 1946 and 19641) are leaving the stage. There now are more millennials than baby boomers in the workforce and, by next year, more millennials than baby boomers are expected to represent the population at large. This passing of the baton is one reason why average hourly earnings continue to grow at a slower pace than most people would have anticipated, given the tightest labour-market conditions since the late 1960s. Upward wage pressure at one end of the distribution spectrum is being offset at the other end: while younger, lower-income cohorts are enjoying a step-up in wage gains, older, more expensive workers are seeing smaller salary boosts or dropping out of full-time employment.
In his press conference on June 13, Fed Chairman Jerome (Jay) Powell was notably positive on the US economic outlook. Although the Fed expects to raise rates in a steady and predictable fashion, the chairman was adamant that the US economy would be able to handle the shift from extraordinary monetary expansiveness to a more neutral setting and, eventually, to a somewhat restrictive one. He also said the Fed is willing to tolerate an inflation rate that runs slightly above its 2% target for the Commerce Department’s price index for personal-consumption expenditures (PCE) price index, as long as that rate is perceived as temporary.
It is almost certain that the Fed will raise rates twice more this year, bringing its policy rate into the 2.25%-to-2.50% range. By the end of next year, the federal funds rate could be over 3%, which presumably will result in a policy rate that is meaningfully above the inflation rate for the first time since the global financial crisis. Exhibit 8 provides a long-term perspective of the federal funds rate versus the core PCE inflation rate (which excludes food and energy), measured on a year-over-year basis.
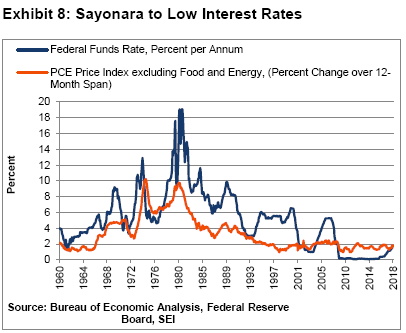
Since 1960, the average spread works out to a real (inflation-adjusted) federal funds rate of 1.8%. Since 1990, that average amounts to only 1.0%, a significant step-down from the average rate of prior decades. By the end of 2020, the Fed is projecting a real federal funds rate of 1.3% (a nominal funds rate of 3.4% minus an expected 2.1% core PCE inflation rate). Whether the central bank continues on its rate-rising course as it projects (turning policy from neutral to restrictive) ultimately depends upon two factors: how the economy responds to the actions it takes until that point, and if inflation is indeed showing signs of persistent acceleration beyond target.
High Noon for Trade
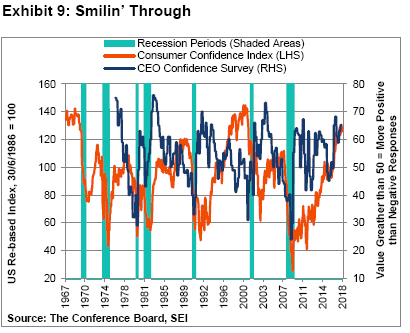
If it weren’t for fears of a trade war pitting America against foes and allies alike, it would be a wonderful life for American investors, businesses and consumers. US corporate tax reform, tax cuts for households and reduced/modified regulation of various industries have led to record-high consumer and business confidence, as Exhibit 9 illustrates. But the imposition of aluminium and steel tariffs on America’s closest allies on the basis of national security is a significant sign that President Donald Trump’s administration is prepared to stress the global trading system in pursuit of its “America First” goals. The personal feud between President Trump and Canadian Prime Minister Justin Trudeau not only torpedoed a calm ending to the June Group of Seven industrial nations summit—it also endangers the North American Free Trade Agreement (NAFTA) negotiations, which had seen progress in recent months. We still think there is less than a 50-50 chance of the US withdrawing from the treaty, but are concerned that those odds have increased over the past month.
Sabre-rattling between America and China, meanwhile, has deteriorated into actual skirmishing. The US imposed a 25% tariff on $50 billion worth of Chinese goods, which, according to the Trump administration, contain industrially significant technologies. Duties will be applied to an initial $34 billion of goods on July 6. China is retaliating in kind. Since trade in goods (both imports and exports) totalled $636 billion during 2017, the sparring to date cannot be termed a full-scale trade war. Unfortunately the latest back-and-forth also suggests this spat will get worse before it gets better. The Trump administration has warned that it is prepared to impose a 10% tariff on another $200 billion of Chinese goods, followed by duties on another $200 billion if China continues to retaliate. This obviously would represent a major escalation toward a full-blown trade war.
Michael Goldstein, quantitative strategist and founder of Empirical Research Partners, has frequently noted that globalization of manufacturing has been the biggest driving force behind the unusually sharp and prolonged rise in profit margins of large American manufacturers. In a recent report that revisited this margin-expansion dynamic2,Goldstein found that the after-tax margin gain for manufacturers within the S&P 500 Index (from 8% in 2000 to 14% in 2018) was the result of several factors: wage savings derived from offshoring and automating shop floors in domestic production facilities (accounting for 34% of the total margin improvement); a major decline in effective tax rates, as multinational companies sought low-taxed jurisdictions and benefited from competitive tax-rate reductions at national and local levels (36%); and the benefits of a secular decline in borrowing costs (30%). Goldstein indicated that gains tied to wage savings from offshoring are now in the rear-view mirror, as are those associated with declining interest rates. The use of robotics in US manufacturing facilities should continue to provide a positive margin impact, while reforms in the US have pushed the effective tax rate sharply lower this year.
In the same report, Empirical Research Partners cited a paper published by the Peterson Institute for International Economics3 that examined how the Trump administration’s soon-to-be-imposed 25% tariffs on $50 billion worth of Chinese high-tech exports will negatively impact multinationals’ supply chains. Exhibit 10 highlights the major product areas targeted, based on a trade law known as Section 3014 and the share of exports originating from foreign-invested enterprises in China.
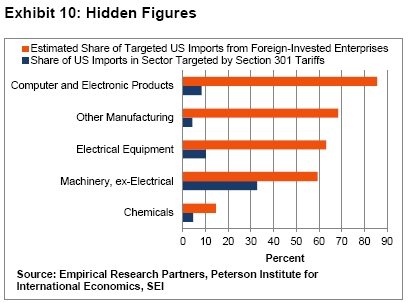
According to the analysis, multinational companies account for half of the value embedded in all Chinese exports. Three-fifths of those exports have been going to the US; of those, 70% represent capital and consumer goods.
The share of computer and electronic products subject to the initial round of Section 301 duties is relatively small at 8.3%. That’s because the administration wants to limit the direct impact of the tariffs on consumer goods such as cell phones and laptops. If President Trump goes through with his promise to slap tariffs on an additional $200 billion in response to China’s tit-for-tat retaliation on the first round of Section 301 duties, we expect households will start to see the impact more clearly on their every-day lives—in the form of higher prices and, perhaps, shortages of desired products.
To be blunt, the strategy of waging a trade war with China could prove to be the equivalent of cutting off one’s nose to spite one’s face. It will likely lead to higher prices for consumers and hurt the bottom lines of companies that sell imported goods and those that depend on global supply chains in the production process. The result should be a net loss for society. A small group of producers will probably benefit substantially from the trade impediments—while most consuming industries and households suffer a decline in purchasing power that may be small at the individual level but would add up to a big loss across the economy.
It would be much cheaper and more efficient to write a check directly to the losers from global trade than to impose a small tax on everyone else. Of course, that alternative is politically unpalatable and perceived as unfair to taxpayers and workers who do not qualify for such relief. It’s easier to impose tariffs, quotas and other impediments to trade that are not nearly as transparent as direct subsidies to beneficiaries of the tariffs.
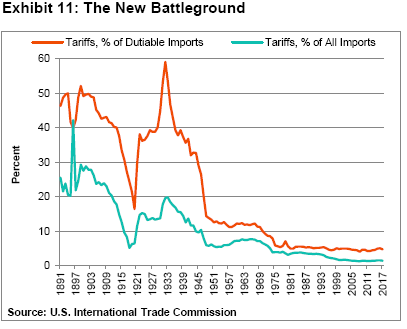
Exhibit 11 highlights the dramatic secular decline in tariffs, both as a percentage of dutiable US imports and of total US imports. To be sure, we do not believe the world is going back to the bad old days of the 1930s, when average tariff rates reached almost 60% on dutiable imports. But the administration’s determination to bend China and other countries to its will is a dangerous stratagem that could very well backfire. We will be watching closely as this drama plays out in the months ahead. With any luck, the Trump administration will shy away from ratcheting tensions further. We must admit that doesn’t seem to be in the cards in the near-term. There will be blood, as they say, if the US engages in tit-for-tat trade wars with the rest of the world or pulls out of NAFTA.
The Big Chill in Europe
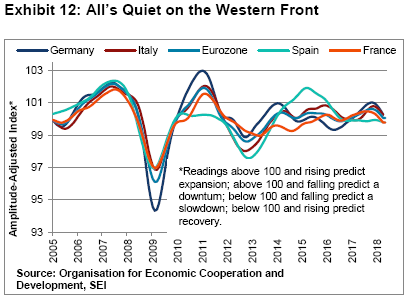
As we noted earlier, the economic data coming out of Europe have been hugely disappointing this year. Instead of building upon the improved business activity seen in 2016 and 2017, there has been a widespread deceleration. As highlighted in Exhibit 12, the Organisation for Economic Co-operation and Development’s (OECD) measure of leading economic indicators (LEI) for the eurozone peaked late in 2017. It is now signalling, at best, growth near its mediocre longer-term trend. France and Spain appear set to expand at a below-trend pace. Italy’s LEI is heading in that direction.
At SEI, we have been reluctant to get too bearish on Europe’s fundamentals. The weakness during the first quarter reflected a variety of one-offs, including poor weather as well as unusually high absenteeism due to the influenza epidemic and industrial strikes (especially in France, where President Emmanuel Macron is pushing hard for economic reforms). Purchasing manager indexes, for example, are still in positive territory, even though they have rolled over from exceptionally high readings at the end of last year. The eurozone unemployment rate continues to move lower too, yet remains elevated compared to that of the US and the UK. Still, the number of officially unemployed persons in the euro area has impressively declined from a high of almost 3.7 million in 2012 to 2.4 million as of April this year. In general, the household sector remains in decent shape.
We also see continued modest acceleration in lending to households and corporations. Although lending-activity growth within major financial institutions remains in the low single-digit territory, it reached its best level in seven years in May. The current lending environment is far better than the outright contraction that occurred during the 2012-to-2015 period.
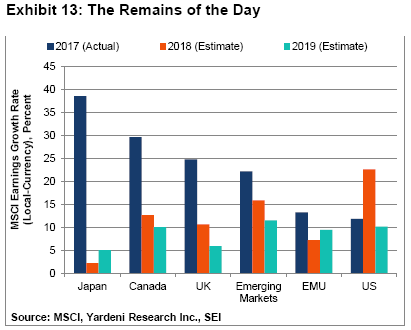
There’s no denying, however, that financial-market participants are disbelievers when it comes to Europe. Analysts’ 2018 and 2019 earnings-growth estimates for companies in the MSCI EMU (European Economic and Monetary Union) Index are quite low compared to those of other major regions and countries, as seen in Exhibit 13.
As European Central Bank (ECB) President Mario Draghi put it at his June 14 press conference, “There has been an undeniable increase in uncertainty” caused by geopolitical events. Yet, the central bank still terms underlying growth as solid despite the soft patch through which the eurozone economy appears to be traversing.
Since deflation risks have moderated significantly in the view of Draghi and the other ECB governors, the decision was made to end net asset purchases by the end of this year. Taking a page out of the Fed’s playbook, Draghi emphasised several times at his press conference that monetary-policy accommodation is ample, and will continue to remain so. In addition to keeping the central bank’s balance sheet steady by reinvesting maturing debt indefinitely, the ECB president stated that policy rates will remain unchanged at least through the summer of 2019 (or later, if needed). In other words: the ECB wants to keep its options open, much as the Fed did in 2015. The pace of interest-rate normalisation will depend on the data.
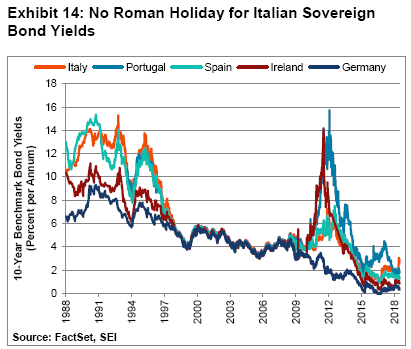
Draghi’s comments were viewed as dovish by the markets, helping to push the euro down sharply against the US dollar. Still, ECB-watchers are concerned that the central bank is on the cusp of repeating its 2011 policy mistake of raising rates two separate times just as the periphery debt crisis was set to hit in full fury. Exhibit 14 shows that European periphery sovereign bond yields have increased in recent weeks, with a particularly sharp spike in the yield for Italian paper. The precipitating event was the formation in Italy of a government coalition composed of the Five Star Movement and Lega (formerly known as the Northern League). Both are populist parties with anti-immigrant, anti-euro and anti-Brussels biases.
The new government in Italy wants to institute a universal basic income scheme, undo previous pension reforms that raised the retirement age, and replace the current income-tax brackets that go up to 43% with two flat rates of 15% and 20%. These are all expensive propositions that would blow a hole in the government’s budget. Even more disastrous would be an attempt to ditch the euro and opt out of the eurozone; although the government has been backtracking on its more extreme anti-euro rhetoric since it became clear that bond vigilantes are alive and well and ready to punish the country for any attempt to escape the eurocurrency straitjacket.
At this point, while we would rule out anything approaching the periphery debt crisis of the 2010-to 2012 period, the events of the past quarter have left investors in European financial assets on edge. Exhibit 15 compares the debt-to-gross domestic product (GDP) of the European periphery countries.
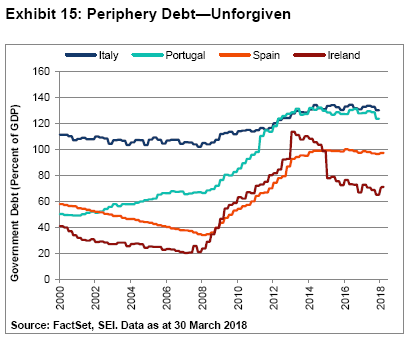
Except for Ireland, little progress has been made as sovereign debt-to-GDP ratios remain near their all-time highs. Since the ECB is no longer a price-insensitive buyer of eurozone debt, we could see yield spreads rise as investors demand a risk premium for those countries with a heavy debt burden relative to the size of their economies. If Italy defies the fiscal rules and adds meaningfully to its fiscal deficit, the country’s bonds are likely to be further discounted by investors—with other periphery bond yields rising in sympathy.
The English Patient: Uncertain Prognosis
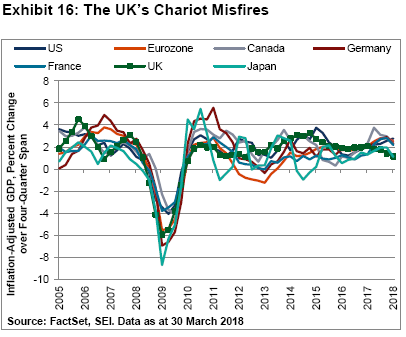
The UK economy looks more like the US in terms of its performance than its European neighbours. Since exiting recession in mid-2009, the country has endured only two small declines in quarterly GDP, both during 2012. When measured on a year-over-year basis (as we do in Exhibit 16) inflation-adjusted GDP shows a slow but fairly consistent pace of improvement. The cumulative rise in inflation-adjusted GDP since the start of the expansion amounts to 18%—close to the 21% advance posted in the US, and well above the cumulative 12% posted by the eurozone. The UK enjoyed a pickup in growth during 2013 and 2014. Since then, gains have slowed to 1.2% for the first quarter of 2018.
Like other countries in Europe, the recent data suggest that the UK is wending its way through a soft patch. Underlying growth appears solid, however, with household spending and capital formation posting steady, albeit modest, gains. The trade sector looks to be a problem spot. The merchandise trade deficit has widened to a record level, continuing a secular decline. However, services and other non-goods trade remain in a surplus position. As a result, the UK actually has registered an improvement in its current-account deficit relative to GDP, averaging 4% over the year ended March from a post-World War II low of 6.4% of GDP over the four quarters ended 2016.
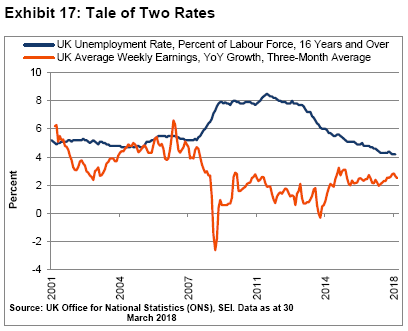
As in the US, UK unemployment sharply declined; the headline rate fell to nearly 4.2% in the first quarter of 2018 from 4.60% one year earlier. Average weekly earnings, however, continued to rise by about 2.5% year over year. Wage gains were considerably faster in the years prior to the global financial crisis, when the unemployment rate fluctuated between 4.5% and 5.0% (as seen in Exhibit 17). Since consumer-price inflation gained 2.4% over the one-year period ending March 31, 2018, inflation-adjusted wage growth remained minimal. All this suggests a stable UK economy. Yet, even with near-full employment, the Bank of England probably won’t be in a hurry to raise its policy rate anytime soon.
The biggest source of uncertainty facing the UK is its looming withdrawal from the EU. The Conservative Party’s internal fight over the country’s future relationship with the EU has stalled progress toward a clear post-Brexit status. If the stakes weren’t so high, the politics would be comical—a blend of the cinematic plots from “Ship of Fools” and “Mutiny on the Bounty.” Although there will be some sort of transition process after the UK officially exits the EU on March 31, 2019, the outline of the resulting relationship is as murky as a thick London fog. There is little consensus, for example, over how to handle the customs border with Ireland. Some want as seamless a border as possible, which means that the UK will need to follow all the rules and regulations of the EU without the benefit of having a vote in the creation of those rules and regulations. Politicians lobbying for a hard Brexit, meanwhile, threaten to topple Prime Minister Theresa May’s government if a more complete sundering of the relationship fails to be negotiated. It’s hard to believe that the referendum to exit the EU occurred two years ago; precious little seems to have been definitively decided since.
Maybe it’s sheer coincidence, but sterling is almost where it was versus the US dollar the day after the Brexit vote on 23 June 2016. The recent trend has been to the downside, as investors worry about the rising odds of a hard Brexit and a more thorough disruption of the country’s trade with the EU. It would not be surprising to see more downside volatility in sterling as we draw closer to the exit date.
Emerging Markets: Les Miserables
At the beginning of “Anna Karenina,” Russian novelist Leo Tolstoy wrote, “All happy families are alike; each unhappy family is unhappy in its own way.” That neatly sums up our view of developing economies and their financial markets, given their idiosyncrasies. A confluence of events, however, has conspired to hurt the performance of a broader grouping of emerging-market assets. An extensive trade war that disrupts multinationals’ supply chains also would disrupt the flow of raw commodities and semi-finished materials from developing economies used as inputs. Rising US interest rates, resulting in another period of sustained US dollar strength, is a second threat. The soft patch in Europe and recent signs of deceleration in China’s economic growth is a third.
Exhibit 18 highlights the currencies of several emerging-market countries versus the US dollar, as measured in units per dollar. The more Argentine pesos, Brazilian reals or Russian rubles per US dollar, for example, the weaker those currencies are against the greenback. Argentina’s economic issues are well known, so it’s not surprising that the peso is the outlier in terms of its huge depreciation against the US dollar. The peso has continued to plummet even after the country qualified for a $50 billion loan from the International Monetary Fund and vowed to pursue conventional economic policies aimed at shoring up its ability to service its debt.
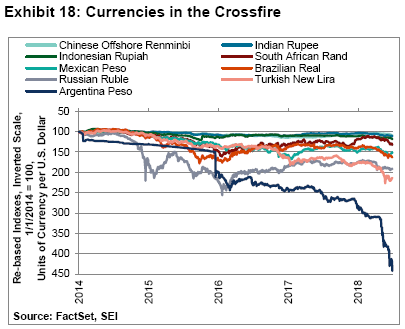
The Turkish lira also has taken a hard knock, with its depreciation picking up steam in mid-May after President Recep Tayyip Erdogan said in an interview with Bloomberg, “Of course our central bank is independent. But the central bank can’t take this independence and set aside the signals given by the president, who’s head of the executive. It will make its evaluations according to this, take its steps according to this.” Perhaps something was lost in translation, but the implication that monetary policy is not independent of the country’s executive branch is problematic for investors. The presidential and parliamentary elections held on June 24 further consolidated Ergodan’s position and will likely lead to additional measures that take the country down an autocratic road.
Beyond Argentina and Turkey (there’s no sense even talking about Venezuela, which is in state of near-economic collapse), other emerging-market currencies have weakened noticeably during the second quarter. Each has its particular unhappiness: The Mexican peso has been gyrating as President Trump threatens to pull the US out of the NAFTA. Mexico’s general elections on July 1, which resulted in a landslide victory for presidential candidate Andres Manuel Lopez Obrador (widely known as AMLO), also influenced the peso—strengthing ahead of the polls and immediately after the votes were tallied, yet weakening by the following morning. Lopez Obrador has been part of Mexico’s political scene for more than three decades. He was a mayor of Mexico City and almost won the presidency on his second try in 2006. He adopted a more moderate image for this election campaign, but his past campaigns had a strongly populist flavour to them. No one’s quite sure how he will govern or how he will deal with President Trump in what has become testy negotiations over NAFTA.
Brazil also has elections coming up in October. A far-right “law-and-order” candidate, Jair Bolsonaro, currently leads a wide-open race. The establishment parties on both the left and the right, meanwhile, have been thoroughly discredited by scandal and the country’s harsh economic recession. Although business activity has been in recovery mode for the past several quarters, the move out of the economic depths has been rather slow and arduous; in fact, the unemployment rate has increased so far this year and is not far from its recessionary peak of 8.3%.
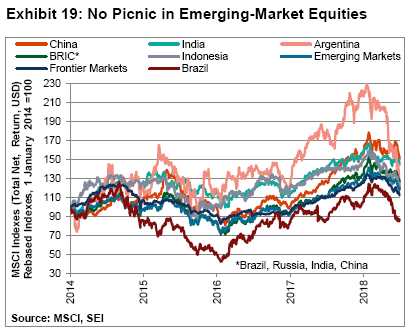
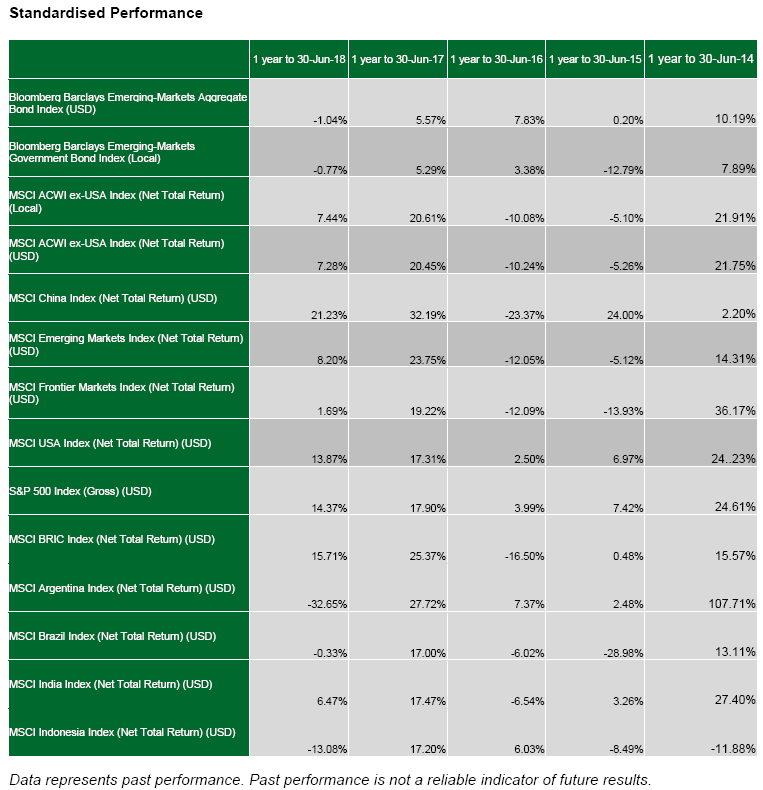
The more resilient currencies in Exhibit 18—the Chinese renminbi (yuan) and Indian rupee—have a history of stability relative to other emerging-market currencies going back more than 20 years. Not surprisingly, their equity markets have not fallen as dramatically as those of other emerging countries in the year-to-date. Exhibit 19 shows the total-return performance of selected emerging-country stock markets versus some popular benchmarks, all in US dollar terms. In the year-to-date, the MSCI China Index (Total Return) is down 1.7% after only recently falling into negative territory. The MSCI Emerging Markets Index (Net Total Return) dropped 7.5%, while the MSCI Frontier Markets Index (Net Total Return) lost 10.7% since the start of the year. From a longer-term perspective, the major emerging-market indices are back to where they were about a year ago and remain well above their early-2016 lows. Even though Argentina’s equity market is down by 45% from its January 2018 peak, it’s still up by more than 25% in US dollar terms from where it was at the start of 2014.
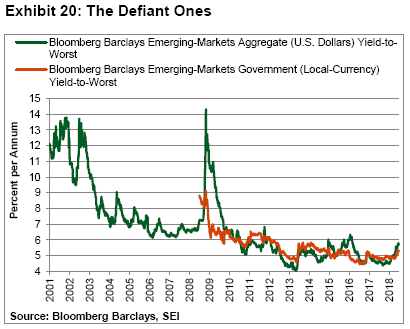
While emerging-market stocks and bonds have come under pressure this year, we’ve yet to see any widespread deterioration in economic performance or in financial conditions. Granted, the central banks of Turkey and Argentina have been forced to move their policy interest rates dramatically higher this year to defend their currencies. Most other countries, however, have kept their short-term rates steady or raised them modestly so far this year. Emerging-market bond yields, meanwhile, still appear contained within the range of the past 10 years for both local and US dollar-denominated sovereign debt, as illustrated in Exhibit 20.
On balance, we think most emerging markets have the ability to weather the storm—again, assuming the disruption to global trade does not devolve into something more encompassing. The majority of developing countries have recorded an improvement in their current-account positions in recent years, allowing them to accumulate foreign currencies. Exceptions to that general trend include Turkey, Argentina, Egypt and Pakistan. These countries also have relatively heavy debt burdens, as do South Africa, Malaysia, Poland, Hungary and the Czech Republic.. On the positive side of the equation, the companies that make up the MSCI Emerging Markets Index are now as profitable as developed European companies (when compared on a return-on-equity basis) while still trading at a cheaper valuation.
The Verdict
We argued three months ago in the Quarterly Outlook that the bull market in risk assets should be given the benefit of the doubt. US share prices have since rebounded 6%, as measured by the S&P 500 Index; although the selloff since mid-June has pared those gains in half. Small-cap stocks, as measured by the Russell 2000 Index (Total Return), advanced 7.75% during the second quarter after gaining almost 12% through mid-June. Admittedly, developed-market performance outside the US was far more mixed, especially when viewed in US dollar terms; emerging-market stocks and bonds were down hard.
Make no mistake about it: the headwinds blowing in the face of risk assets have picked up. Growth in business activity has slowed a bit, especially in Europe. Monetary policy in the US is getting tighter, and is set to become less expansionary in Europe as well. Some developing countries have been forced to raise their policy rates dramatically in order to defend their currencies. Most important, the stoking of trade-war tensions by the US threatens to undermine the very foundation of the system that has supported the global economy since the end of World War II. No wonder investors are as nervous as a cat on a hot tin roof. Although the actual trade actions to date have been modest, the potential impact on future developments on global supply chains bears close watching.
As we noted earlier, the economic fundamentals that drive the stock market still appear solid—even in Europe and developing economies. Plus, interest rates remain at levels that won’t crunch global economic growth. The key risks—escalating trade tensions and the polarization of electorates over issues like immigration and fiscal sovereignty—appear more political in nature. The positives include a still-solid global economy; strong momentum in corporate profits growth; and equity valuations that still appear reasonable against the backdrop of still-low, albeit rising, interest rates. Signs of financial stress remain isolated to the weaker economies; although Italy is an important case, owing to its size and position as a major eurozone country.
A broadening of the trade war with China or a US departure from the NAFTA accord would likely have a severely negative impact on the profitability of US manufacturers, prompting us to reassess our still-positive view. Impediments to trade also could lead to a higher inflation rate as domestic companies use the tariffs umbrella to raise their selling prices. The Fed may feel compelled to lean against this threat to price stability, thereby aggravating any economic shock arising from the disruption of global supply chains. This is how a bear market could develop.
We want to emphasise that this is not our base-case scenario. In our view, this old bull has some life left in it. That being said, the risks to the equity market now seem more balanced rather than skewed to the bullish side. We believe it’s important to be mindful of threats coming at you from the blind side.
Important Information
This material is not directed to any persons where (by reason of that person's nationality, residence or otherwise) the publication or availability of this material is prohibited. Persons in respect of whom such prohibitions apply must not rely on this information in any respect whatsoever. Investment in the funds or products that are described herein are available only to intended recipients and this communication must not be relied upon or acted upon by anyone who is not an intended recipient.
While considerable care has been taken to ensure the information contained within this document is accurate and up-to-date, no warranty is given as to the accuracy or completeness of any information and no liability is accepted for any errors or omissions in such information or any action taken on the basis of this information.
SEI Investments (Europe) Limited acts as distributor of collective investment schemes which are authorised in Ireland pursuant to the UCITS regulations and which are collectively referred to as the “SEI Funds” in these materials. These umbrella funds are incorporated in Ireland as limited liability investment companies and are managed by SEI Investments Global Limited, an affiliate of the distributor. SEI Investments (Europe) Limited utilises the SEI Funds in its asset management programme to create asset allocation strategies for its clients. Any reference in this document to any SEI Funds should not be construed as a recommendation to buy or sell these securities or to engage in any related investment management services. Recipients of this information who intend to apply for shares in any SEI Fund are reminded that any such application must be made solely on the basis of the information contained in the Prospectus (which includes a schedule of fees and charges and maximum commission available). Commissions and incentives may be paid and if so, would be included in the overall costs.) A copy of the Prospectus can be obtained by contacting your Financial Advisor, SEI Relationship Manager or by using the contact details shown below.
Data refers to past performance. Past performance is not a reliable indicator of future results. Investments in SEI Funds are generally medium- to long-term investments. The value of an investment and any income from it can go down as well as up. Returns may increase or decrease as a result of currency fluctuations. Investors may get back less than the original amount invested. SEI Funds may use derivative instruments which may be used for hedging purposes and/or investment purposes. This material represents an assessment of the market environment at a specific point in time and is not intended to be a forecast of future events.
In addition to the usual risks associated with investing, the following risks may apply: Bonds and bond funds are subject to interest rate risk and will decline in value as interest rates rise. High-yield bonds involve greater risks of default or downgrade and are more volatile than investment-grade securities, due to the speculative nature of their investments. International investments may involve risk of capital loss from unfavourable fluctuation in currency values, from differences in generally accepted accounting principles or from economic or political instability in other nations. Emerging markets involve heightened risks related to the same factors as well as increased volatility and lower trading volume. Narrowly focused investments, securities focusing on a single country, and investments in smaller companies typically exhibit higher volatility.
This information is issued by SEI Investments (Europe) Limited (“SIEL”) 1st Floor, Alphabeta, 14-18 Finsbury Square, London EC2A 1BR, United Kingdom. SIEL is authorised and regulated by the Financial Conduct Authority (FRN 191713).
SEI sources data directly from FactSet, Lipper, and BlackRock unless otherwise stated.
Important Notes:
The SEI Funds may not be offered or sold to the public in Argentina, Brazil, Chile, Colombia, Mexico, Peru, Venezuela or any other country in Central or South America. Accordingly, the offering of shares of the SEI Funds has not been submitted for approval in these jurisdictions. Documents relating to the SEI Funds (as well as information contained herein) may not be supplied to the general public for purposes of a public offering in the above jurisdictions or be used in connection with any offer or subscription for sale to the public in such jurisdictions.


