Diversification: It’s Not Always Easy to Do the Right Thing
Everybody loves a winner
With the upward momentum in global stock markets showing no signs of abating, the traditional well-diversified investment portfolio has fallen out of favour. While diversification is a time-tested method of portfolio construction that has reduced risk (standard deviation) and delivered more consistent returns, it doesn’t deliver the kind of attention-grabbing performance that has been making headlines. So, as is often the case during periods of strong equity performance, investors are generally left disappointed when comparing diversified portfolio returns with those of a single index.
Diversification rarely wins in any given year…
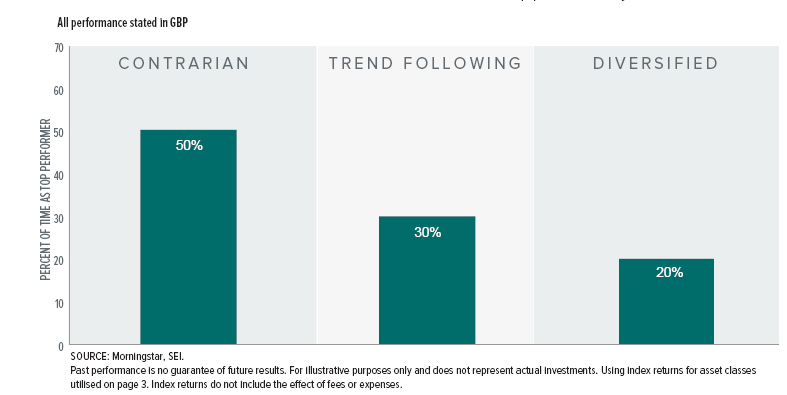
Many investors want to buy last year’s winner; in the short-term, this strategy sometimes works well. Over the past 10 years, a trend-following strategy—one that invested in the top-performing asset class from the prior year—would have been the top performer 30% of the time. Meanwhile, a contrarian strategy—one that invested in the worst-performing asset class from the prior year—would have been the top performer 50% of the time. A diversified strategy that invested equally in each asset class would have been the top performer only 20% of the time.
…But diversification also rarely lost
Looking solely at how often each strategy outperformed tells only part of the story. When considering the number of times each strategy was the bottom performer, we observe that the trend-following and contrarian styles finished worst 60% and 30% of the time, respectively. The diversified strategy finished last only once in 10 years, returning 14.4% in 2010—still a robust gain, above the long-term expected and historical average returns for a diversified strategy and nearly equal to the 14.5% gain registered by the contrarian style that year.
The proof
While the trend-following and contrarian strategies tend to have a greater opportunity to register headline-grabbing short-term outperformance, they also have the highest tendency to underperform. The diversified strategy may not have the same opportunity to achieve dramatic short-term gains, but it may help minimize significant losses in a given year. Over longer, multi-year periods, a strategy that successfully avoids significant losses will tend to outperform and experience less volatility. This is the reason responsible financial advisors recommend diversification as the right thing to do for their clients.
If we examine the most recent 10-year period as a whole, we observe that the trend-following strategy actually lost value despite being the top performer in three separate years. This resulted in an average loss of 0.8% per year and came with relatively high volatility of 17.5% annually. The contrarian strategy performed significantly better, gaining 4.7% annually, although with stunningly high volatility of 25.5%. The diversified strategy easily outpaced both, with an average gain of 7.2% and only 9.8% volatility. It’s clear that the strategy with the most consistent returns came out on top in the long-term.
It’s not always easy to do the right thing
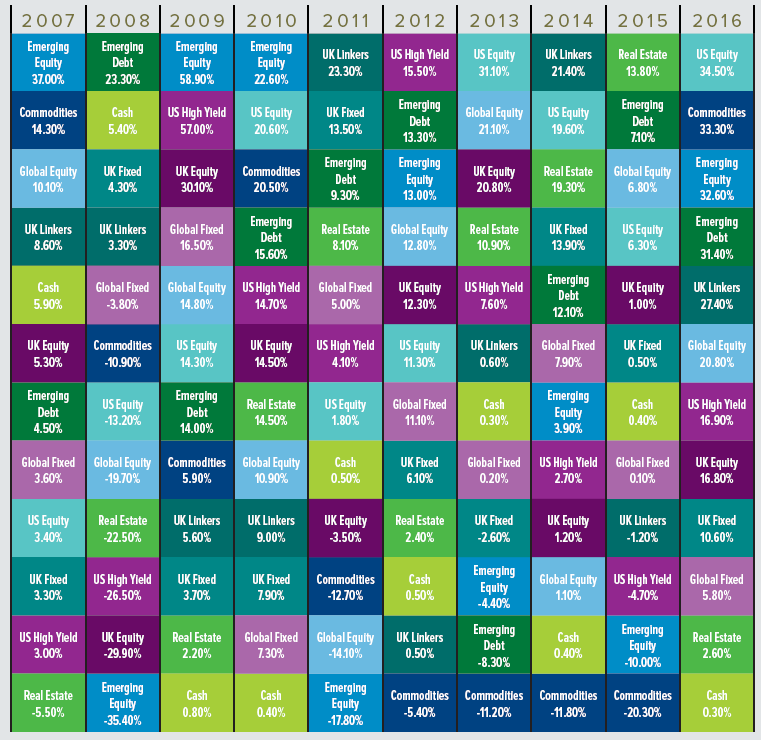
Over the past decade, prudent financial advisors have had to defend performance of well-diversified portfolios in eight out of 10 annual client meetings. (See chart on page 1.) While this task may seem daunting, just imagine having to defend a trend- following emerging-market equities portfolio after it plummeted by 35.4% in 2008. The contrarian strategy presented similar challenges following consecutive losses of 11.2%, 11.8% and 20.3%, respectively, from 2013 to 2015 in a portfolio concentrated in commodities.
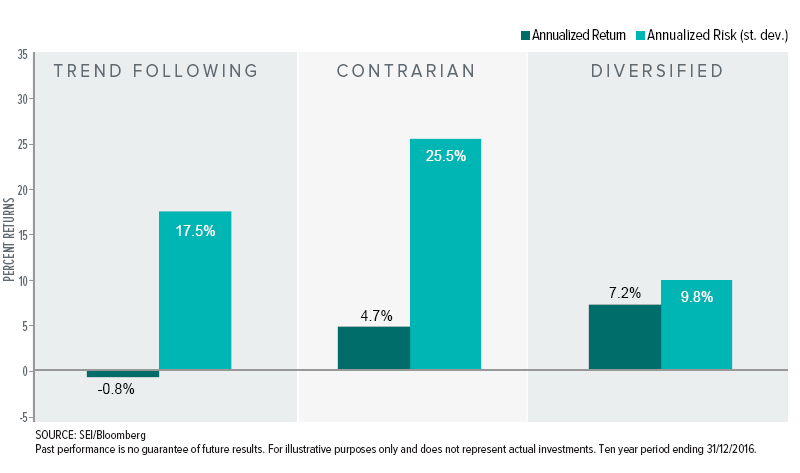
Chart disclosures
Asset-class returns are based on the same indices as indicated on page 4. Performance begins 1/1/2007 and continues through 12/31/2016. In each of these years, “Trend Following” uses the current-year return of best-performing asset class of the previous year. “Contrarian” uses the current year return of the worst-performing asset class of the previous year. “Diversified” uses a return equal to the return of a portfolio of equally weighted asset-class returns in each year.
Asset class definitions
Asset categories represented by: UK Equity (FTSE UK Series All Share Index), US Equity (Russell 3000 Index), Global Equity (MSCI EAFE ex-UK, Net), Emerging Equity (MSCI Emerging Markets Index, Net), Global Fixed (Bloomberg Barclays Global Aggregate Corporate Index, Hedged), UK Fixed (BofA Merrill Lynch Sterling Broad Market Index), UK Linkers (FTSE Actuaries UK Index-Linked Gilts Over 5 Years Index), US High Yield (BofA Merrill Lynch US High Yield Constrained Index, Hedged), Emerging Debt (JP Morgan EMBI Global), Real Estate (IPD UK All Property Total Return Index), Commodities (Bloomberg Commodity Total Return Index), Cash (BofA Merrill Lynch British Pound 1-Month Deposit Bid Rate Average Index). Performance in GBP, data as of 31 December 2016.
Important Information
This document and its contents are directed only at persons who have been classified by SEI Investments (Europe) Limited as a Professional Client for the purposes of the FCA Conduct of Business Sourcebook.
This information is issued by SEI Investments (Europe) Limited, 1st Floor, Alphabeta, 14-18 Finsbury Square, London EC2A 1BR, which is authorised and regulated by the Financial Conduct Authority.
No offer of any security is made hereby. Recipients of this information who intend to apply for shares in any SEI Fund are reminded that any such application may be made solely on the basis of the information contained in the Prospectus.
This material represents an assessment of the market environment at a specific point in time and is not intended to be a forecast of future events, or a guarantee of future results. This information should not be relied upon by the reader as research or investment advice regarding the funds or any stock in particular, nor should it be construed as a recommendation to purchase or sell a security, including futures contracts.
The value of an investment and any income from it can go down as well as up. Investors may not get back the original amount invested. In addition to the normal risks associated with equity investing, international investments may involve risk of capital loss from unfavourable fluctuation in currency values, from differences in generally accepted accounting principles or from economic or political instability in other nations. Bonds and bond funds are subject to interest rate risk and will decline in value as interest rates rise. High yield bonds involve greater risks of default or downgrade and are more volatile than investment grade securities, due to the speculative nature of their investments. Narrowly focused investments and smaller companies typically exhibit higher volatility. Diversification does not ensure a profit or guarantee against a loss.
Whilst considerable care has been taken to ensure the information contained within this document is accurate and up-to-date, no warranty is given as to the accuracy or completeness of any information and no liability is accepted for any errors or omissions in such information or any action taken on the basis of this information.
Past performance is not a guarantee of future performance.
Investments in SEI Funds are generally medium to long term investments.
SEI sources data directly from Factset, Lipper, and BlackRock, unless otherwise stated.


