Attempting to Avoid a Recession: Fortune or Folly?
We’re often asked the question, “If there’s a recession on the horizon, what should investors do about it?” Inside the circles of investment professionals, conventional wisdom says you should never try to time a recession. Getting the timing right on not just one major decision point, but two—when to exit the market and when to reenter—is both ambitious and risky. Yet we can’t help but sympathise. It’s natural to wonder whether there is some way to avoid the pain of a downturn. Is there a realistic basis to think that trying to time a recession is a chance worth taking?
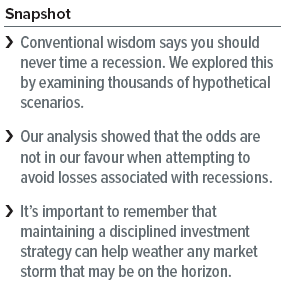
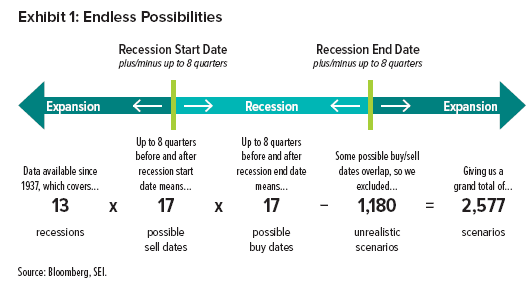
To explore this possibility, we looked at the last 13 recessions in the US dating back to 1937. US data was used due to availability of a longer history; we believe the core conclusions of the analysis should be the same for any geography or market. We considered a range of sell-and-buy scenarios surrounding the official start and end dates of each recession, as determined by the National Bureau of Economic Research (or NBER, a private, non-profit, non-partisan organisation). The timing of our hypothetical decisions to sell out of the market and buy back into the market varied by up to eight quarters before and after each actual recession start and end date. This gave us a grand total of 2,577 scenarios to consider, as highlighted in Exhibit 1.
While eight quarters may seem like a fairly wide margin of error, keep in mind that many of today’s investors have been anxious about recession since 2018—a recession that has yet to arrive in 2019 and is, in our view, still nearly two years away (see our most recent Economic Outlook for the rationale). That’s our best guess anyway. But it’s anyone’s guess really, and that’s the point. Also, based on the 13 economic cycles we considered, expansions have ranged anywhere from one year to 10 years, with a standard deviation of 10 quarters; it therefore seems that plus-or-minus eight quarters is a reasonable starting point.
But for the sake of argument, we also narrowed the margin of error to just plus-or-minus four quarters (rather than eight), putting the spotlight on 853 scenarios—a smaller subset of the 2,577 scenarios. To assess the outcome of these recession-dodging scenarios, we used the S&P 500 Index as “the market” and we assumed that cash gets stuffed under that mattress, earning no return, when out of the market. We found this smaller group of 853 scenarios averaged a loss of nearly 10% relative to remaining fully invested through the downturn. Only about one-third of attempted dodges were successful (producing a positive return relative to staying fully invested). And the magnitude of losses, on average, exceeded that of gains by a multiple of 1.5 times.
What can we learn from these hypothetical attempts to avoid being hurt by a recession? On average, it turns out that market timing is a losing strategy—even when reducing the margin of error. In fact, further shrinking the margin of error to plus-or-minus two quarters (rather than four) left us with the same lesson: Investors tend to be more successful when they remain fully invested throughout recessions. Exhibit 2 shows the average returns for different margins of error.
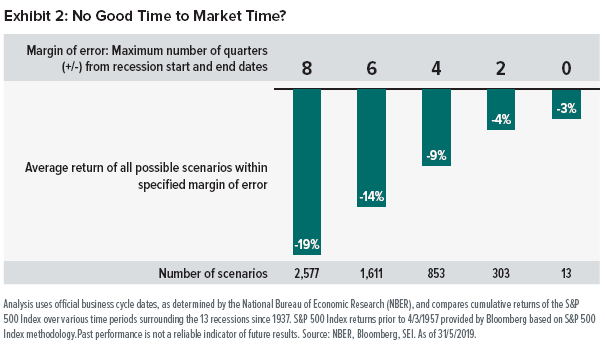
Even when narrowing the margin of error to zero—meaning we timed each recession exactly right—the average return was negative 3%. Why would we still see a loss with the full benefit of hindsight? Expansions and recessions are part of the economic cycle, which is not necessarily aligned with the market cycle.
Nobody can predict the future
If any reasonable forecasting ability exists in the world of investing, it probably resides within the economic cycle rather than the market cycle. The bravest of economic forecasters may suggest that an economic cycle is relatively well-behaved, exhibiting steadier trends and clearer relationships between macroeconomic variables. However, even if we accept this to be true, predicting its turning points is particularly challenging. As one macroeconomist has put it, “The record of failure to predict recessions is virtually unblemished.” This was the sentiment that Prakash Loungani expressed in his 2000 research report for the International Monetary Fund, “How Accurate Are Private Sector Forecasts: Cross-Country Evidence From Consensus Forecasts of Output Growth”— which he then echoed in subsequent updates: “Can economists forecast recessions? Some evidence from the Great Recession,” Ahir and Loungani, 2014; “How Well Do Economists Forecast Recessions?,” An, Jalles and Loungani, 2018.
If economic cycles are difficult to predict, market cycles must be next to impossible. Relative to macroeconomic indicators such as gross domestic product, inflation and employment, the behaviour of financial markets can be faster-moving, noisier, more driven by sentiment, and detached from economic fundamentals. Even if we could make accurate recession forecasts, it remains unclear whether we could profit from our predictions (as illustrated by the 3% average loss across 13 recessions depicted in Exhibit 2). And the speed and efficiency with which markets incorporate new information unfortunately make it increasingly difficult to forecast any financial variable that would have more direct linkage to potential profits. It’s a “catch 22” of financial markets: The clearer it is that you could profit from an accurate forecast of a financial variable, the more difficult it is to accurately forecast in the first place. Essentially, to successfully time markets, you have to be a better forecaster than the market as a whole. That’s a very high bar.
Suffice it to say, we think our analysis is more than fair; examining various windows that surround actual recession dates already builds in a generous amount of hindsight. When attempting to avoid the losses associated with recessions, the odds are simply not in our favour Exhibit 3 helps to bring this into focus.
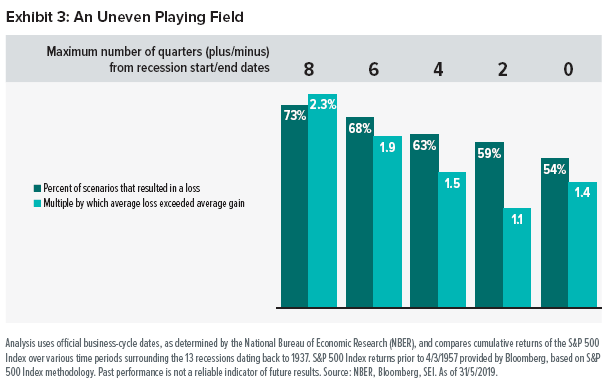
Looking at the same 2,577 scenarios and subsets thereof, Exhibit 3 shows that the majority of attempts to avoid a recession leave investors worse off than if they had simply stayed put. And, importantly, the magnitude of the loss when you get it wrong far outweighs the gain if you somehow manage to beat the odds and get it right: On average, losses are larger than gains (relative to staying fully invested) by a multiple of about two times in many cases. Not only are there steep consequences to getting the timing wrong, the rewards do not appear to be adequate compensation for the risk.
Consider, for example, the roughly 1,600 scenarios that got the timing right within plus-or-minus six quarters: We lost over two-thirds of the time, with an average loss of almost 30%. In the remaining one-third of positive scenarios, we averaged a gain of about 15%—half the magnitude of average losses.
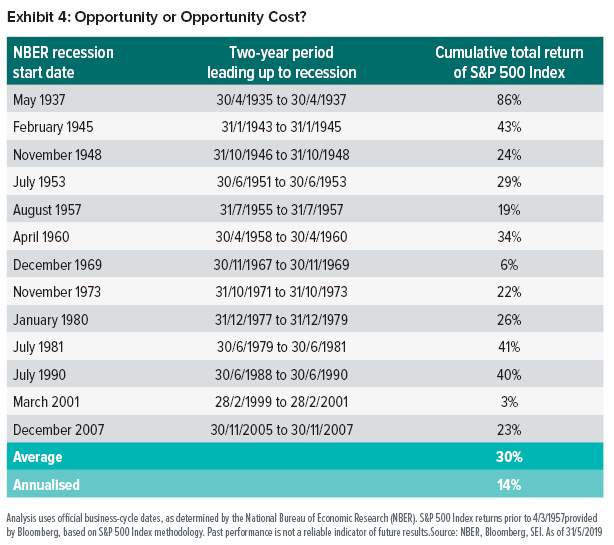
Staring at a chart of past performance, it’s deceptively easy to think that market peaks and troughs are obvious. The influence of hindsight can easily start to create the perception that they’re also easy to spot going forward. But identifying tops and bottoms as markets are moving in real time is a completely different story. It’s very difficult and can be costly, as opportunity costs of missing late-cycle returns or potentially sharp rebounds can stack up quickly. (We explored this at the end of 2018 in our paper, “The U.S. Bull Market: Is it Time to Get Out?”) Exhibit 4 shows late-cycle returns in the two years leading up to each of the last 13 recessions.
Some other interesting observations from the analysis:
- If we followed a reactive strategy for which we were two quarters late on both the exit and re-entry, the average loss was 23%. This is an intuitive strategy to test, given the conventional way of identifying a recession by observing two consecutive quarters of negative gross domestic product readings.
- If we sold six quarters ahead of a recession (perhaps roughly where we sit today), the average loss across all re-entry scenarios within just plus-or-minus two quarters of the recession end date was 16%.
- Generally, performance has varied inversely with length of time out of the market, which also means the window to get it right is quite narrow. We do not find this surprising given that markets have a positive expected return over time.
Staying Diversified, Staying Invested
To more grizzled investors, we may be preaching to the choir. But to the more skeptical (or just plain curious) among us, we hope this analysis will provide renewed confidence that maintaining a disciplined investment strategy can help weather any storm that may be on the horizon. For those who manage to stay the course, the data shows the playing field is tilted in their favour.
We’re not suggesting that the answer to our original question is “do nothing.” In fact, actively-managed portfolios have already budgeted for a prudent amount of room to maneuver without straying too far from their strategic positioning. And, more importantly, if a portfolio has somehow drifted toward a more concentrated mix of investments over the course of an expansion, taking the opportunity to diversify may help mitigate recession-related losses. When signs of a downturn emerge, it can also serve as an important reminder for investors to review their goals and investment objectives—making sure that portfolios are taking the minimum amount of risk possible, while remaining appropriately positioned in pursuit of those goals and objectives.
Index definition
The S&P 500 Index is an unmanaged, market-capitalisation weighted index comprising 500 of the largest publicly traded US companies and is considered representative of the broad US stock market.
Important Information
Data refers to past performance. Past performance is not a reliable indicator of future results.
Investments in SEI Funds are generally medium- to long-term investments. The value of an investment and any income from it can go down as well as up. Investors may get back less than the original amount invested. Returns may increase or decrease as a result of currency fluctuations. Additionally, this investment may not be suitable for everyone. If you should have any doubt whether it is suitable for you, you should obtain expert advice.
No offer of any security is made hereby. Recipients of this information who intend to apply for shares in any SEI Fund are reminded that any such application may be made solely on the basis of the information contained in the Prospectus. This material represents an assessment of the market environment at a specific point in time and is not intended to be a forecast of future events, or a guarantee of future results.
This information should not be relied upon by the reader as research or investment advice regarding the funds or any stock in particular, nor should it be construed as a recommendation to purchase or sell a security, including futures contracts.
In addition to the normal risks associated with equity investing, international investments may involve risk of capital loss from unfavourable fluctuation in currency values, from differences in generally accepted accounting principles or from economic or political instability in other nations. Bonds and bond funds are subject to interest rate risk and will decline in value as interest rates rise. High yield bonds involve greater risks of default or downgrade and are more volatile than investment grade securities, due to the speculative nature of their investments. Narrowly focused investments and smaller companies typically exhibit higher volatility. SEI Funds may use derivative instruments such as futures, forwards, options, swaps, contracts for differences, credit derivatives, caps, floors and currency forward contracts. These instruments may be used for hedging purposes and/or investment purposes.
While considerable care has been taken to ensure the information contained within this document is accurate and up-to-date, no warranty is given as to the accuracy or completeness of any information and no liability is accepted for any errors or omissions in such information or any action taken on the basis of this information.
This information is issued by SEI Investments (Europe) Limited, 1st Floor, Alphabeta, 14-18 Finsbury Square, London EC2A 1BR which is authorised and regulated by the Financial Conduct Authority. Please refer to our latest Full Prospectus (which includes information in relation to the use of derivatives and the risks associated with the use of derivative instruments), Key Investor Information Documents and latest Annual or Semi-Annual Reports for more information on our funds. This information can be obtained by contacting your Financial Adviser or using the contact details shown above. SEI sources data directly from FactSet, Lipper, and BlackRock, unless otherwise stated.
The opinions and views in this commentary are of SEI only and are subject to change. They should not be construed as investment advice.


