Aging Bull Underscores Benefit of Active Management
One could be forgiven for thinking that a successful investment strategy requires little effort or skill if they had only ever observed the past nine years of market performance. After all, over this period—amid massive central-bank stimulus, low interest rates, and the second-longest bull market in history—passive equity strategies (which mirror an index) have generally outperformed those that are actively managed. In fact, one could even be forgiven for coming to this conclusion after having observed most other periods of market strength. This phenomenon is not unique to the current narrowly focused equity bull market: passive strategies generally shine brighter as market performance strengthens, particularly amid high stock correlations (the measure of how closely securities move in relation to each other) and low stock dispersion (the difference between best- and worst-performing securities).
Does this mean investors should only bother with actively managed strategies during bear markets (when stock prices are falling) and avoid them altogether during bull markets? We don’t think so. In fact, we view the advanced age of the current bull market as an important reminder that markets go through many cycles—especially given the early-February 2018 US stock-market correction (that is, when an index declines 10% or more from its recent high), which followed the strongest January for the S&P 500 Index in more than 20 years—and that actively managed strategies may play a crucial role in navigating these changes throughout the course of a long-term investment plan. While limiting an investment portfolio to passive strategies may seem sufficient in the vacuum of a bull market, the broader historical picture tells a more nuanced story; in more “normal” markets, performance is driven mainly by fundamentals, valuations and earnings.
Making Sense of the Cycles: The Case for Active
The benefit of active investing has already begun to reveal itself in the aging and increasingly volatile (but still-present) bull market: the third and fourth quarters of 2017 saw lower stock correlation and increased dispersion, making the environment more conducive to active management. Even as equity indexes continued to generate solid returns, for example, 55% of US large-cap core managers and 79% of US large-cap value managers outperformed their style benchmarks in these two quarters[1].This shift appears to have been in anticipation of global equity market changes—much of which was driven by the US Federal Reserve beginning to taper its bond-buying programme, thereby starting to roll back a policy that has provided massive market stimulus. The central bank also indicated that it will continue to hike its federal funds rate. We are also seeing other central banks around the world starting to shift from an easing of monetary policy to tightening: the Bank of Mexico, Bank of Canada, Bank of Korea and the People’s Bank of China, for example, have each raised interest rates in recent months.
Passive: Favoured by a Factor of Five?
The solid performance of the S&P 500 Index (which has become the default index cited in debates about the merits of passive investing) has generated media attention, especially with the low fees of strategies that seek to replicate its performance.
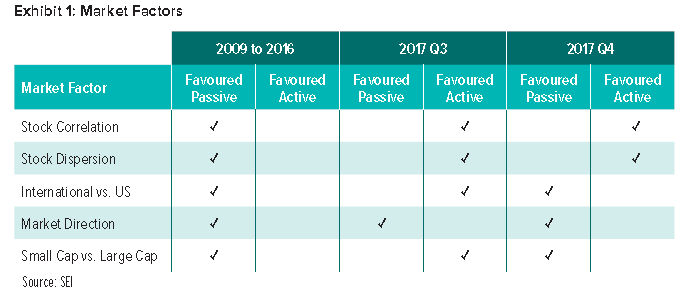
Plus, out of five market factors that favour either passive or active investment management in a given period—stock correlation, stock dispersion, international versus US performance, small- versus large-capitalisation performance, and market direction—have all favoured passive since the current bull was born in 2009. But things began to dramatically change in the third and fourth quarters of 2017 (Exhibit 1).
When looking beyond the past eight years of S&P 500 Index performance and market factors, however, the case for passive investing significantly weakens as the cyclical nature of the equity market comes into view. It becomes clear that passive investors are along for a rearview ride, watching the market drivers of yesteryear. On the contrary, we believe that active investors are in a position to capitalise on or get ahead of declining market trends.
Bulls of Past and Present Market Cycles
It’s easy to see historical parallels when comparing the global equity market of today with those of the 1970s and 1990s.
That Nifty Fifty 70s Bull
The 1970s were marked by more than disco balls and feathered hair. Like today, they were also marked by a narrow global equity market—with US companies making up a large majority of total global market capitalisation (as measured by the MSCI ACWI Index) and a mere 50 companies in the S&P 500 Index dominating returns. The so-called Nifty Fifty, for which investors were willing to pay a hefty premium for growth at any price, traded at 80 times earnings compared to 19 times earnings for the overall S&P 500 Index.
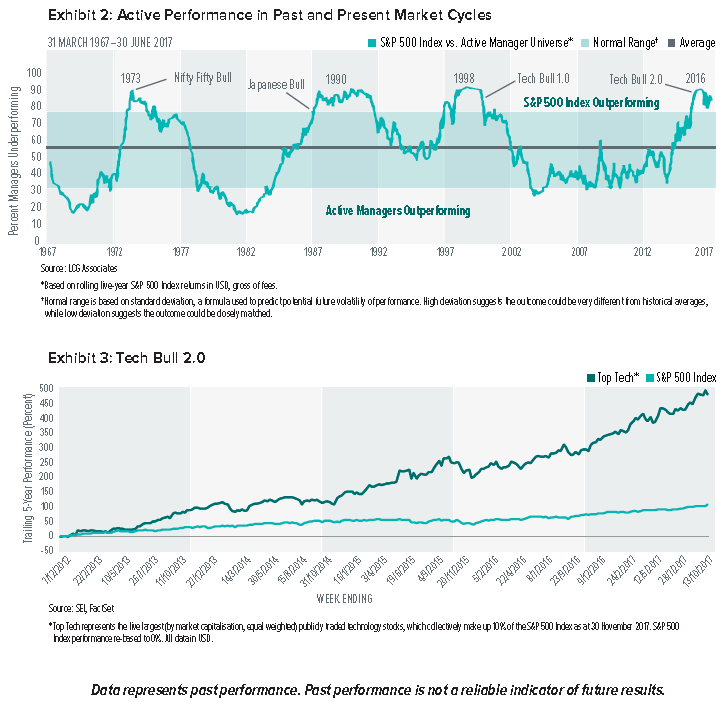
Similar to today, there was a lot of money flowing into the market with little discernment for valuations. And narrow markets, high correlations and low dispersions did not bode any better for active management than they have in recent years: during the Nifty-Fifty period, the S&P 500 Index outperformed over 80% of US active managers (based on a five-year rolling average, as illustrated in Exhibit 2).
By the end of the decade, the Index’s performance began to unravel and the Nifty Fifty was viewed as far less nifty. People started to pay greater attention to fundamentals and valuations, spurring a new era: in the early 1980s, over 80% of active managers were outperforming the S&P 500 Index, based on a five-year rolling average (Exhibit 2).
Japanese Bull
As we moved from the feathered hair of the 1970s to the crimped and teased hair of the 1980s, the US equity market became increasingly concentrated in larger-capitalisation multi-national companies—thanks in large part to international flows, particularly from Japan—and passive strategies once again performed well. However, this ultimately unraveled as the Japanese equity bubble burst and the US experienced a sharp correction in 1987. As investors redirected their focus on company fundamentals, active management regained strength that lasted into the early 1990s.
Tech Bull 1.0
The 1990s brought the emergence of the “Tech Bubble,” which provided another narrow market reminiscent of today’s environment. During this period, the extreme growth of internet-based technology companies caused excessive confidence in these kinds of stocks. This resulted in market outperformance that was concentrated in a select number of companies—which, in turn, fueled a false promise of growth as many of these companies lacked earnings. Active managers tended to trail the S&P 500 Index, just as they did when the Nifty Fifty reigned supreme. That is, until the Tech Bubble burst in 2000. Most actively managed strategies subsequently regained their relative strength, as was the case when the Nifty Fifty began to unravel (Exhibit 2).
Tech Bull 2.0
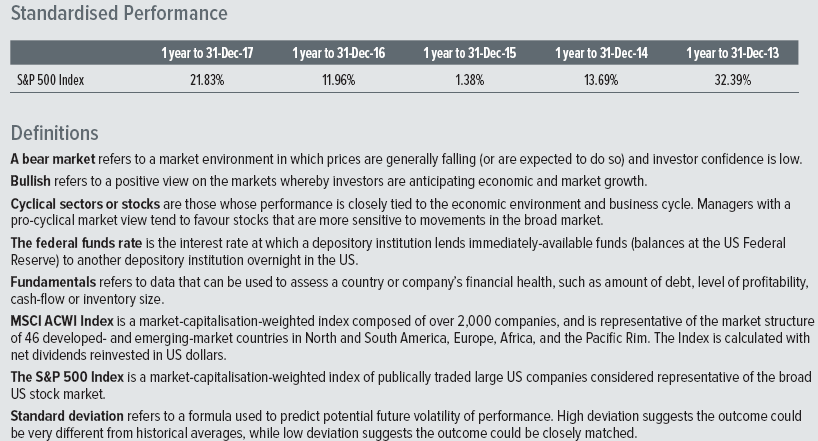
Today, with passively managed strategies once again outperforming most active managers, we find ourselves in another market inflated by the soaring returns of a small number of stocks—in this case, just five technology/e-commerce companies have been driving performance (Exhibit 3). Meanwhile, the technology sector’s weighting in the S&P 500 Index is approaching the all-time high reached during the Tech Bubble of the 1990s. Plus, as another source of déjà vu: the US once again dominates global equities in terms of market capitalisation, having expanded in the post-financial-crisis period with its economic growth outpacing that of the rest of the developed world.
However, as we anticipated (having taken our cue from previous expanding bubbles and aging bulls), US equity market capitalisation recently began to correct. We expect this to continue, with US equities ultimately shrinking relative to the rest of the world, particularly with emerging markets having persistently expanded as well (now representing almost 25% of global equity market capitalisation according to MSCI).
Choosing to Actively Invest in the Future
With current market leadership broadening beyond large-capitalisation, technology and US stocks, we believe the market should once again punish complacency and reward active stock selection. We already saw a preview of this in early February, when the S&P 500 Index entered correction territory by falling 10% from its all-time highs—thereby kicking off a recalibration of stock valuations that should continue to result in lower correlations and increased dispersion, both of which tend to support actively managed strategies.
We expect the already-strengthening environment for active management to continue over a period of at least 5 to 10 years once the current bull market begins to recede. While passively managed strategies are bound to ride out downturns, actively managed equity strategies like those managed by SEI are able to take actions that could help mitigate potential losses. Our sub-advisors take a highly active approach to the security-selection process, analysing each company’s fundamentals, management quality and potential performance-changing catalysts. This leads to research-based conclusions about valuations, which results in conscious views about which companies to hold or not hold at a given time.
Another implication of a weakening equity market is that passive flows create a high concentration of stocks that are more richly priced than their estimated fair value. Our sub-advisors are well-equipped to navigate this: an emphasis on security and sector selection allows them to reduce exposure to overvalued stocks—something that cannot be controlled in a passively managed strategy, which indiscriminately buys the market (from high-quality to low-quality stocks and everything in between).
The bull market has brought the proliferation of passive vehicles that fared well over the past eight years, having greatly benefitted from a narrow concentration of the mega technology stocks. Yet inevitable downturns (like the recent correction) could spark a widespread selloff of today’s most popular stocks and, just as significant, a broadening of the market (meaning less concentration and lower correlations). During such periods of extreme volatility, companies with more reasonable valuations and sustainable fundamentals should offer a comparatively appealing proposition to investors when overvalued stocks lose their lustre in a “risk-off” environment. And while passively managed strategies remain paralysed by their lack of discretion, the sub-advisors in our US equity mandates will maintain the ability to actively manage their strategies—seeking greater exposure to high-quality companies compared to their respective benchmarks.
Choosing active management can enhance the attractive characteristics of a portfolio and help improve long-term performance. As the current bull continues to age, we expect actively managed strategies to benefit from the equity market having an increased focus on fundamentals (such as valuations and earnings growth); moderate inflation (which would translate into pricing power for competitive companies); and the five market factors shifting toward favouring active management. No matter what the future may hold, we are confident that our actively managed equity strategies are well-positioned over the long term.
Important Information
Data refers to past performance. Past performance is not a reliable indicator of future results.
Investments in SEI Funds are generally medium- to long-term investments. The value of an investment and any income from it can go down as well as up. Investors may get back less than the original amount invested. Returns may increase or decrease as a result of currency fluctuations. Additionally, this investment may not be suitable for everyone. If you should have any doubt whether it is suitable for you, you should obtain expert advice.
No offer of any security is made hereby. Recipients of this information who intend to apply for shares in any SEI Fund are reminded that any such application may be made solely on the basis of the information contained in the Prospectus. This material represents an assessment of the market environment at a specific point in time and is not intended to be a forecast of future events, or a guarantee of future results. This information should not be relied upon by the reader as research or investment advice regarding the funds or any stock in particular, nor should it be construed as a recommendation to purchase or sell a security, including futures contracts.
In addition to the normal risks associated with equity investing, international investments may involve risk of capital loss from unfavourable fluctuation in currency values, from differences in generally accepted accounting principles or from economic or political instability in other nations. Bonds and bond funds are subject to interest rate risk and will decline in value as interest rates rise. High yield bonds involve greater risks of default or downgrade and are more volatile than investment grade securities, due to the speculative nature of their investments. Narrowly focused investments and smaller companies typically exhibit higher volatility. SEI Funds may use derivative instruments such as futures, forwards, options, swaps, contracts for differences, credit derivatives, caps, floors and currency forward contracts. These instruments may be used for hedging purposes and/or investment purposes.
While considerable care has been taken to ensure the information contained within this document is accurate and up-to-date, no warranty is given as to the accuracy or completeness of any information and no liability is accepted for any errors or omissions in such information or any action taken on the basis of this information.
This information is issued by SEI Investments (Europe) Limited, 1st Floor, Alphabeta, 14-18 Finsbury Square, London EC2A 1BR which is authorised and regulated by the
Financial Conduct Authority. Please refer to our latest Full Prospectus (which includes information in relation to the use of derivatives and the risks associated with the use of derivative instruments), Key Investor Information Documents and latest Annual or Semi-Annual Reports for more information on our funds. This information can be obtained by contacting your Financial Adviser or using the contact details shown above.


