After Forced Selling, is it Time for a Small-Cap Comeback?
At the start of what would become the previous two US bear markets in 2000 and 2007, the S&P 500 Index had dropped about 5% one month after reaching its peak levels at the time.
However, just 30 days after hitting an all-time high on 19 February 2020, the S&P 500 Index had fallen by more than 30%, as seen in Exhibit 1.
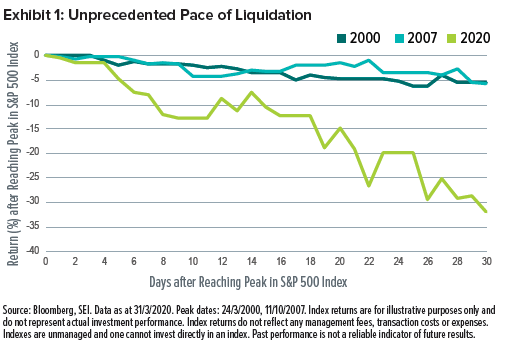
The rapid pace of selling in March 2020 was historical. Why? The coronavirus (“Covid-19”) outbreak was a completely unexpected and outsized external shock. Plus, its eventual economic impact remains uncertain.
Defensive sectors, such as utilities and consumer staples, typically provide some measure of risk mitigation in a falling market at the cost of not rising as much in an upward move. Cyclical securities, such as those in the industrials and information technology sectors, usually rise in tandem with the market—but also generally drop faster when the market falls.
We can see this in the betas of stocks by sector. Broadly speaking, beta measures how much a stock moves relative to the overall market. Think of it as the comparative riskiness of a stock for an investor.
A broad equity index has a beta of 1. A stock that moves less than the market appears less risky and therefore has a beta of less than 1. On the other hand, stocks that move more than the market are seen as riskier and have a beta of higher than 1.
The speed and magnitude of the coronavirus outbreak hit equity markets in an unprecedented way. Between the Russell 3000 Index peak on 19 February 2020 and 31 March 2020, there was surprisingly little difference in returns between those sectors perceived as lower-risk and those perceived as higher-risk before the crisis (Exhibit 2).
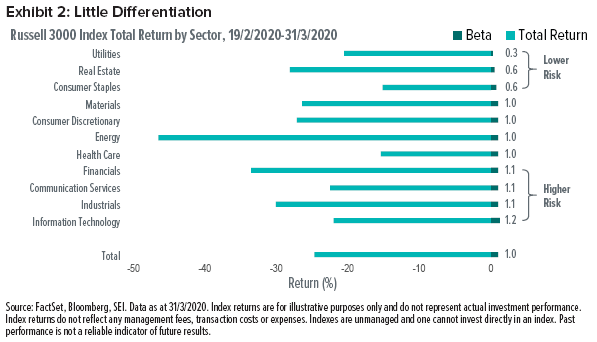
On 12 March 2020, when the Russell 3000 Index sold off by almost 10%, the utilities sector lost slightly more than the market overall—and much more than the information technology sector1. In fact, utilities lagged most sectors, including materials, industrials and consumer discretionary that day—and in the very environment that we would have expected the sector to outperform.
It is challenging to find a risk-driven reason to understand why this was the case. Clearly, something was going on in the market during this period that was a differentiator. It does not appear related to risk properties, nor to defensiveness or cyclicality. So then what was it?
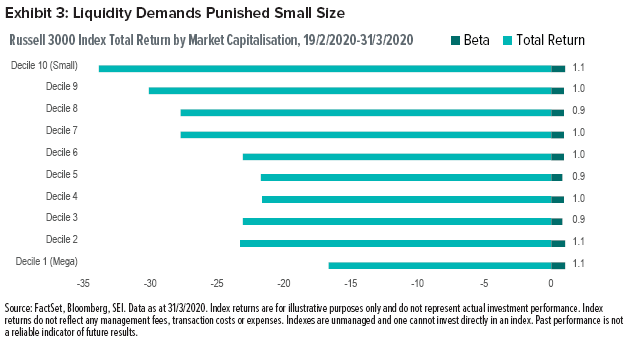
Size looks to have been the differentiator. The Russell 3000 Index can be grouped into deciles by company size. Each decile represents 10% of the market capitalisation of the Index. Decile 1 is the largest 10% of the market and includes just three names: Apple, Amazon and Microsoft. At the other end of the spectrum, Decile 10 represents the smallest 10% of the Index. It represents most of the stock count, but only 10% of the weight, and includes small companies that don’t consume much weight in terms of market capitalisation.
We can see a strong relationship between company size and return from the high on 19 February 2020 through 31 March 2020 (Exhibit 3). Mega-cap stocks were in a league of their own, and most of the large-cap companies (deciles 2 through 7) also fared better. The mid-cap stocks of the Index (deciles 8 and 9) lagged. Small-cap companies were severely punished, with returns twice as bad as mega-cap returns.
Size, of course, is related to liquidity. And, when the market panics, investors generally seek liquidity and tend to sell at any cost. The smaller the stock, the lower the price a seller usually offers to entice buyers.
This Has Happened Before
Another example of a surprise shock was after the terrorist attack in the US on 11 September 2001. The Russell 2000 Index (which consists of small-cap stocks) underperformed the Russell 1000 Index (consisting of large-cap stocks) through the end of that month in reaction to an external event as sellers searched for buyers in a forced liquidation. The prices of smaller companies fell further than their large-cap counterparts because of the greater desire to sell relative to the market capitalisation of those stocks.
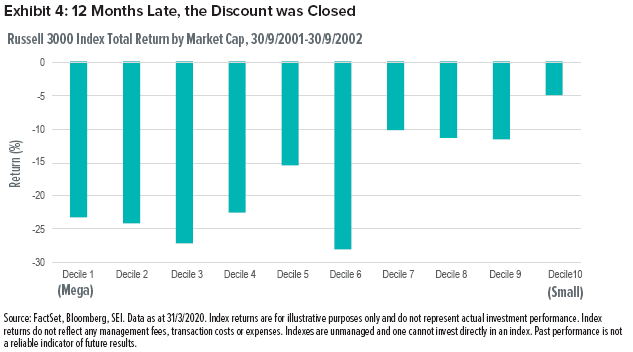
The initial shock of 9/11 turned into a protracted recession in the US. The overall equity market continued deteriorating over the next 12 months. However, the larger-cap stocks suffered substantially more than small caps during this time. Decile 10 of the Russell 3000 Index, which represents the smallest 10% of market cap in the market, outperformed their large-cap counterparts by 15% to 20%.
History leads us to believe that external shocks (such as the one caused by COVID-19) initially produce forced sellers and forced liquidations. When that happens, the less liquid a security is, the greater the impact it has on relative returns. Eventually, discrimination does return, and selectivity and fundamental analysis can become more important.
Just because a stock is small does not mean it is overvalued (or overexposed to the current environment). Looking at the past, we see that deeply-discounted securities did get scooped up relatively quickly.
How Can Active Management Benefit?
One common practice in active management is the tendency to underweight the largest companies because market capitalisation is one rule that many indexes must follow. The larger (or smaller) the stock is, the larger (or smaller) the dollar allocation is to that stock.
Over the last several years, we’ve seen mega-cap names dominate the market and put pressure on active management. What has happened over the last month is truly extraordinary. Many small- and mid-caps lagged by 15% to 20%, and that has hurt many active managers’ positions. But, as has happened in the past, we believe that dynamic will eventually normalise—and that active management has an opportunity to benefit from it.
Index Definitions
Russell 3000 Index: an unmanaged, capitalisation-weighted index that measures the performance of the largest 3000 U.S. companies representing approximately 98% of the investable U.S. equity market.
S&P 500 Index: an unmanaged, capitalisation-weighted index that consists of 500 of the largest publicly-traded U.S. companies and is considered representative of the broad U.S. stock market.
Important Information
The opinions and views in this commentary are of SEI only and are subject to change. They should not be construed as investment advice.
Investments in SEI Funds are generally medium- to long-term investments. The value of an investment and any income from it can go down as well as up. Investors may get back less than the original amount invested. Returns may increase or decrease as a result of currency fluctuations. Past performance is not a reliable indicator of future results. Additionally, this investment may not be suitable for everyone. If you should have any doubt whether it is suitable for you, you should obtain expert advice.
The SEI Global Assets Fund Plc, SEI Global Investments Fund Plc, and SEI Global Master Fund Plc (the “SEI Funds”) are structured as open-ended collective investment schemes and are authorised in Ireland by the Central Bank as a UCITS pursuant to the UCITS Regulations. The SEI Funds are managed by SEI Investments, Global Ltd (“SIGL”). SIGL has appointed SEI Investments (Europe) Ltd (“SIEL”), an affiliate of SIGL, (together “SEI”) to provide general distribution services in relation to the SEI Funds either directly or through the appointment of other sub-distributors. The SEI Funds may not be marketed to the general public except in jurisdictions where the funds have been registered by the relevant regulator. The matrix of the SEI fund registrations can be found here seic.com/GlobalFundRegistrations.
No offer of any security is made hereby. Recipients of this information who intend to apply for shares in any SEI Fund are reminded that any such application may be made solely on the basis of the information contained in the Prospectus. This material represents an assessment of the market environment at a specific point in time and is not intended to be a forecast of future events, or a guarantee of future results. This information should not be relied upon by the reader as research or investment advice regarding the funds or any stock in particular, nor should it be construed as a recommendation to purchase or sell a security, including futures contracts.
In addition to the normal risks associated with equity investing, international investments may involve risk of capital loss from unfavourable fluctuation in currency values, from differences in generally accepted accounting principles or from economic or political instability in other nations. Bonds and bond funds are subject to interest rate risk and will decline in value as interest rates rise. High yield bonds involve greater risks of default or downgrade and are more volatile than investment grade securities, due to the speculative nature of their investments. Narrowly focused investments and smaller companies typically exhibit higher volatility. SEI Funds may use derivative instruments such as futures, forwards, options, swaps, contracts for differences, credit derivatives, caps, floors and currency forward contracts. These instruments may be used for hedging purposes and/or investment purposes.
While considerable care has been taken to ensure the information contained within this document is accurate and up-to-date, no warranty is given as to the accuracy or completeness of any information and no liability is accepted for any errors or omissions in such information or any action taken on the basis of this information.
This information is issued by SEI Investments (Europe) Limited, 1st Floor, Alphabeta, 14-18 Finsbury Square, London EC2A 1BR which is authorised and regulated by the Financial Conduct Authority. Please refer to our latest Full Prospectus (which includes information in relation to the use of derivatives and the risks associated with the use of derivative instruments), Key Investor Information Documents and latest Annual or Semi-Annual Reports for more information on our funds. This information can be obtained by contacting your Financial Adviser or using the contact details shown above. SEI sources data directly from FactSet, Lipper, and BlackRock, unless otherwise stated.


