Wall Street bulls, Main Street bears. (Long Version)
It was the best of times, it was the worst of times.
-Charles Dickens, “A Tale of Two Cities”
All happy families are alike; each unhappy family is unhappy in its own way.
-Leo Tolstoy, “Anna Karenina”
As we look back on 2025 and ahead to 2026, we are most struck by the resilience of the financial markets in the face of so much political and economic uncertainty and turmoil. Despite the U.S. government’s imposition of the highest tariffs since the 1930s, the global economy posted an estimated gain of 2.7% for the year, as measured by inflation-adjusted gross domestic product (real GDP). Among the major developed economies, the U.S. led the way with growth in the 2.00%-to-2.25% range. By contrast, business activity in Canada, the U.K., the eurozone, and Japan was rather sluggish in the 1.0%-to-1.7% area1.
This pedestrian pace of growth did not hold back equity markets, however. Through December, large-cap stocks, as measured by the Russell 1000 Index, recorded a year-to-date total return of 17.4%. Unlike previous years, other equity classes also performed well. Small-cap stocks, as represented by the Russell 2000 Index, climbed 12.8%. International equities, meanwhile, did even better than U.S. large caps, with the MSCI ACWI ex USA Index (total return) recording a 25.1% appreciation in local-currency terms and 33.1% from the perspective of an unhedged U.S. investor (the result of an 8% decline in the value of the dollar). Even fixed-income investors enjoyed decent gains, ranging from 7.3% for the Bloomberg U.S. Aggregate Bond Index (total return) to 14.3% on the J.P. Morgan Emerging Markets Bond Index.
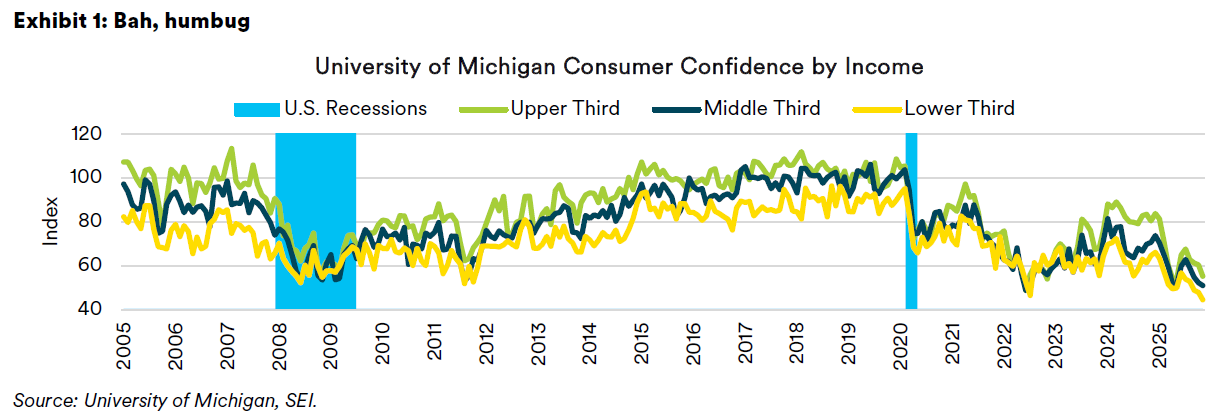
Yet, even in the U.S., people are not in the best of moods. Exhibit 1 tracks the University of Michigan’s Index of Consumer Sentiment by income. It should be no surprise that the highest income group usually has the highest confidence while the lowest third on the income scale are usually the least confident. This year, however, confidence has fallen off a cliff for all three groups, sinking to levels even below those recorded in 2022 when interest rates were soaring and the stock market was falling sharply. The most recent readings are also below those seen in 2008 during the Great Recession and global financial crisis.
Affordability is the issue of the day. It has put the Trump administration and the Republican Party on the defensive. One might think that the upper-income group would feel better about the world. The sharp increase in their wealth over the past three years has been phenomenal. But perhaps their sour mood reflects the difficulty their children are having with establishing themselves given the burdens of heavy student-loan debt and prohibitively high mortgage rates putting the American dream of home ownership out of reach for many. Other countries that face surly voters include the U.K., France, and Germany.
1 IMF. (2026). Real GDP Growth, Annual percent change (2026). Washington, DC: International Monetary Fund. https://www.imf.org/external/datamapper/NGDP_RPCH@WEO/USA/GBR/CAN/DEU/FRA/JPN/ITA?year=2026.
Our prediction scorecard
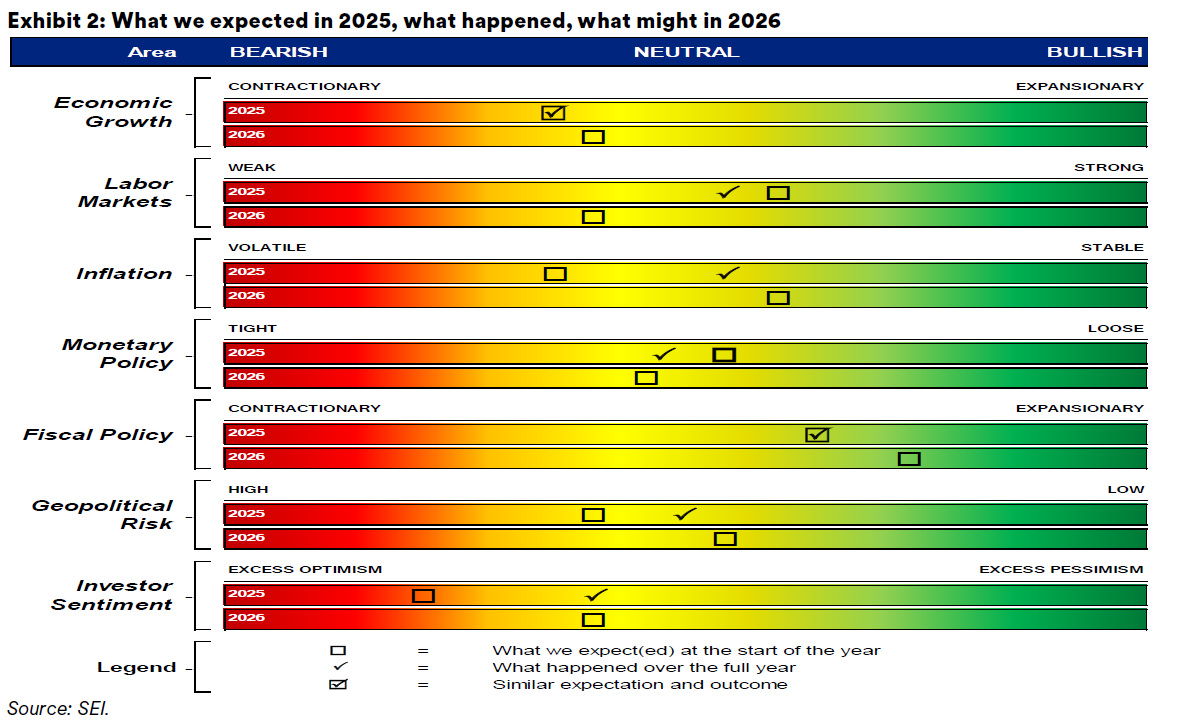
Exhibit 2 provides our stylized depiction of SEI’s 2025 and 2026 views on key economic data points and policy issues. Our original forecast for 2025, made at the end of 2024, is represented by the boxes in the top bars for each category; checkmarks denote actual outcomes at the end of 2025. As previously cautioned when presenting this template, this is not a quantitative exercise. It is meant to illustrate the degree to which our expectations for 2025 proved accurate.
Economic growth. Our forecast for global economic growth in 2025 should turn out to be mostly within our expectations. We looked for inflation-adjusted GDP to advance from 2.0% to 2.5% in the U.S., and from 1.0% to 1.5% in Canada, the U.K., and Europe. Economists’ consensus estimates have penciled in growth of 2% or more in the U.S., 1.1% for Canada, 1.4% for the U.K., and 1.3% for the eurozone. The U.S. was the standout performer in 2025, extending its growth leadership among developed economies. The economy even gained momentum over the course of 2025: After a soft patch in the first quarter, when businesses pulled forward import purchases ahead of new tariffs causing a temporary drag, GDP rebounded strongly. Real output grew at a 3.8% annualized rate in the following quarter – the strongest since 2023 – and expanded at an even sharper 4.3% rate in the third quarter.
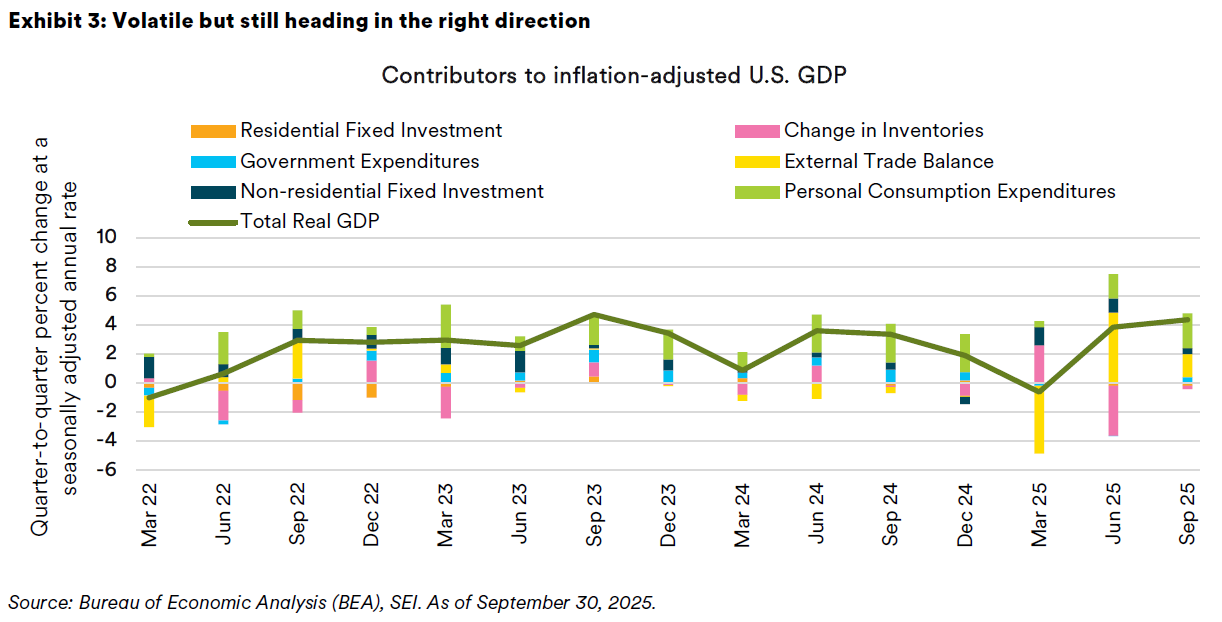
Several factors powered U.S. outperformance: Consumer spending remained solid, thanks to the baby boomers and other affluent households that have benefited from the surging value of their investment portfolios. Business investment also was a major driver—particularly in technology and infrastructure related to artificial intelligence (AI). The nation’s tech giants unleashed a capital expenditure boom to build out AI data centers and all that goes with them, including semiconductors and software. This “AI tsunami” of spending contributed significantly to U.S. GDP, even as higher interest rates and tariff-related uncertainty depressed capital spending in other industries. Exhibit 3 tracks the contribution to GDP growth of the major components on a quarter-to-quarter basis at an annual rate. Note that the two most volatile components of U.S. GDP this year have been the trade sector (exports minus imports) and the change in inventories; both reflect the impact of the sharp shifts in trade policy from one quarter to the next.
Unlike the U.S., other major economies failed to accelerate and, in some cases, nearly stalled. Germany—the eurozone’s industrial engine—flirted with recession in 2025. Germany’s output barely grew, weighed down by persistently soft manufacturing demand. German exports to China have been weak in recent years, and 2025 was no exception as China’s domestic demand remained soft. Europe’s manufacturing malaise was compounded by high energy costs. Although natural gas and electricity prices are well off their 2022 peaks, European industry continues to pay far more for power than U.S. firms. GDP in the U.K. was flattered by a strong start to the year; however, growth has since slowed due to the tightening of fiscal policy and sluggish household spending. The government’s tax policies have dented consumer confidence, and household saving has been unusually high. Canada’s economy grew by around 1%, supported by stronger consumer spending (benefiting from easing inflation and targeted tax breaks), but it was hit by U.S. tariffs on Canadian steel, aluminum, and autos. Those tariffs undermined exports, offsetting some gains from lower inflation and a boost from the repeal of Canada’s consumer-facing fuel charge in early 2025.
While the eurozone should see an uptick in growth in 2026 supported by fiscal stimulus and low interest rates, the U.K. could register a further slowing. Fiscal policy continues to weigh on both businesses and consumers. Real disposable income will likely slow more in the U.K. than in other major economies owing to higher taxes and still-sticky, elevated inflation. Business profitability has been poor, although analysts are penciling a rebound in 2026. As was the case in 2025, government consumption and investment will likely be the largest contributor to U.K. GDP in 2026. Canada also faces another year of challenges. The U.S.-Mexico-Canada Agreement (USMCA) trade treaty comes up for review this year, and there will likely be tough negotiations with the Trump administration. There has been no warming of relations since the Premier of Ontario angered President Trump over a TV commercial that implicitly criticized current U.S. trade policy. About 85% to 90% of exports to the U.S. entered the country duty-free in 2025 thanks to the USMCA. As a result, the effective tariff rate on goods entering the U.S. from Canada amounted to only 5% to 6% versus a nominal rate of 35%. In the coming negotiations, the U.S. will seek to maximize domestic manufacturing and jobs, reduce the bilateral trade deficit, block Chinese supply-chain circumvention, and link trade with immigration and security.
Japan and China presented a mixed picture. Japan saw modest growth (1.2%) as it finally emerged from decades of deflation. Consumer spending held up, and inbound tourism improved; momentum was limited by manufacturing softness and an export slump in mid-2025. By contrast, China managed respectable growth by its new standards. Despite internal headwinds (a persistent property downturn and cautious consumers), China’s GDP expanded by 4.8% to 5% in 2025 (although we always take the country’s official GDP estimates with a large grain of salt). This slightly exceeded our initial forecast, thanks mainly to government stimulus and a strong export sector. Beijing ramped up infrastructure spending and rolled out incentives for consumers in late 2024 that carried into 2025. Crucially, Chinese exports performed better than expected, rising on shipments to Southeast Asia and Europe that helped offset a sharp decline in exports to the U.S. Many global firms also front-loaded orders from China in the first half of 2025 to get ahead of impending U.S. tariff hikes—a factor that temporarily boosted China’s factory output. These export tailwinds allowed China to compensate for weak domestic demand. However, this export-driven strategy resembles China’s post-2008 playbook and may not be sustainable over the long term.
Japan is currently in a tiff with China over comments made by the new Japanese prime minister regarding defense policy in the event China invades Taiwan. China has retaliated by throttling back visitations of tourists to the country and banning Japanese seafood exports. It also has made a formal protest to the United Nations. These moves, while psychologically jarring, should have only a modest impact on Japan’s economy. A possible expansion of the boycott to Japanese autos and other goods would have a more significant effect, reducing Japan’s annual GDP by some 0.3%, according to Oxford Economics.
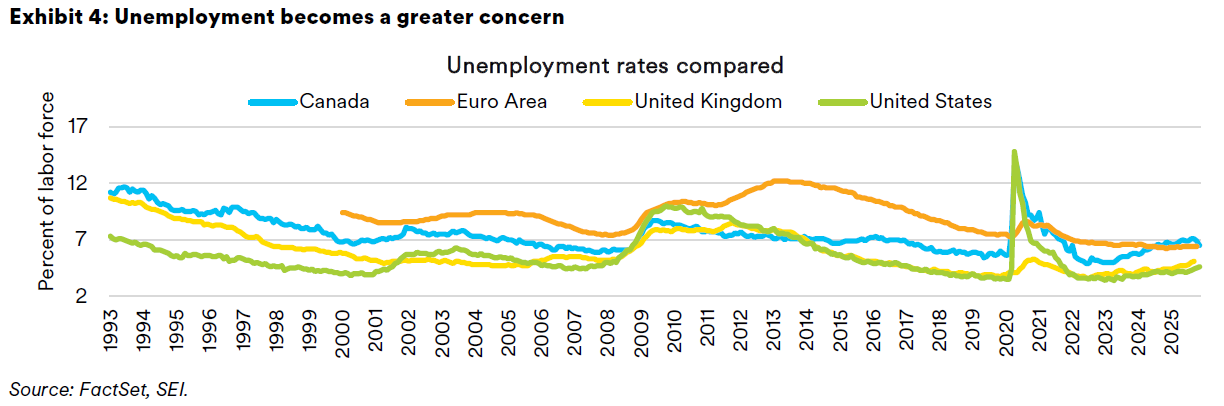
Labor markets. Labor markets in 2025 stayed relatively tight by historical standards, although there were signs of cooling that we did not anticipate at the start of last year. As we highlight in Exhibit 4, the unemployment rate in the U.S. increased from a 54-year low of 3.4% in early 2023 to a four-year high of 4.6% in November 2025. Despite increasing by more than one percentage point, joblessness remained notably low compared to past norms (the U.S. jobless rate averaged 5.7% in the 2010s). Similarly, the U.K. saw its jobless rate move up from 3.6% in mid-2022 to 5.1% as of September this year. Eurozone unemployment has held steady at 6.4%, just off the record low for the regional bloc. By contrast, Canada’s unemployment rate jumped markedly, reaching 7.1% in August and September before moving back to 6.9% in October and 6.5% by November. Complicating the country’s weak employment growth is the fact that Canada’s labor force has expanded dramatically on record immigration and 7% population growth since 2022. Job creation simply couldn’t keep up; the rising rate reflects an excess of workers adding to this year’s tariff-related economic stress.
At SEI, we continue to believe that the rising U.S. unemployment rate will be constrained by slowing growth of the labor force. Migrant encounters at the southern border have plummeted from 3.2 million people in fiscal year 2023 (ending September)—first falling modestly in fiscal year 2024 to 2.9 million on efforts by the Biden administration to stanch the flow, before dwindling to 693,000 total encounters in fiscal year 2025. For the current fiscal year (ending September 2026) we expect less than 350,000 encounters, with perhaps a third of that total apprehended and then deported. The Department of Homeland Security (DHS) has claimed that it is on pace to deport more than 600,000 people without legal status by the end of President Trump’s first year in office. Also contributing to the decline is that it has become much more expensive and difficult for legal immigrants to obtain H-1B work visas. Combined with the natural contraction of domestic-born workers as baby boomers and older members of Gen X drop out of the workforce, the smaller inflow of foreign workers suggests that the current low hiring pace is consistent with a generally steady unemployment rate. According to the Federal Reserve Bank of Dallas, the unemployment rate in the U.S. will tend to remain the same if growth in non-farm payrolls totals just 30,000 workers per month. This breakeven estimate was closer to 300,000 as recently as 2023.
In Europe and Japan, an aging population and labor scarcity are common themes. While the eurozone’s 6.4% unemployment rate is higher than the 4.6% in the U.S., this is largely due to structural differences (for example, higher youth unemployment in southern Europe, strict hiring rules that make labor markets generally less flexible, and more generous unemployment benefits that reduce the incentive to find a job). Many European countries are effectively at full employment for the first time in memory. Germany and France face worker shortages in skilled trades and healthcare, and their demographics are worsening. Japan maintains a low 2.7% unemployment rate, with a shrinking workforce. Britain saw an unusual drop in participation post-Brexit and post-COVID as many older workers left the workforce. This decline has not fully reversed.
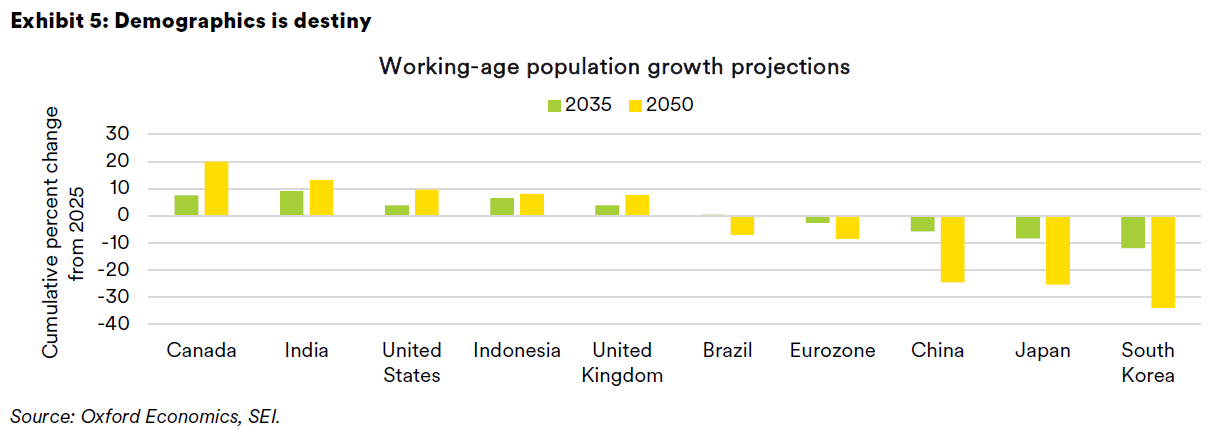
As we highlight in Exhibit 5, the demographic headwinds are expected to stiffen in the decades ahead. The eurozone, China, Japan, and South Korea are already facing declines in their working-age populations. By 2050, the cumulative decline from 2025 will be nothing short of stunning. Demographers anticipate that China and Japan’s working-age population will fall by 25% from today’s level, and that South Korea will face a 34% contraction. Canada, the U.S., and the U.K. should still register gains, but these projections include a rise in immigration levels in addition to fertility rates closer to replacement levels compared to those countries in population decline. India takes the prize for having the largest working-age population at one billion compared to China, which is currently at 987 million. The gap is expected to widen in favor of India over the next 25 years, with the country’s labor force reaching 1.13 billion while China’s working-age population contracts to 745 million. Given these demographic trends, it is easy to see why China is devoting vast resources to improving its technological capabilities in areas such as robotics and artificial intelligence.
Steady-to-lower inflation
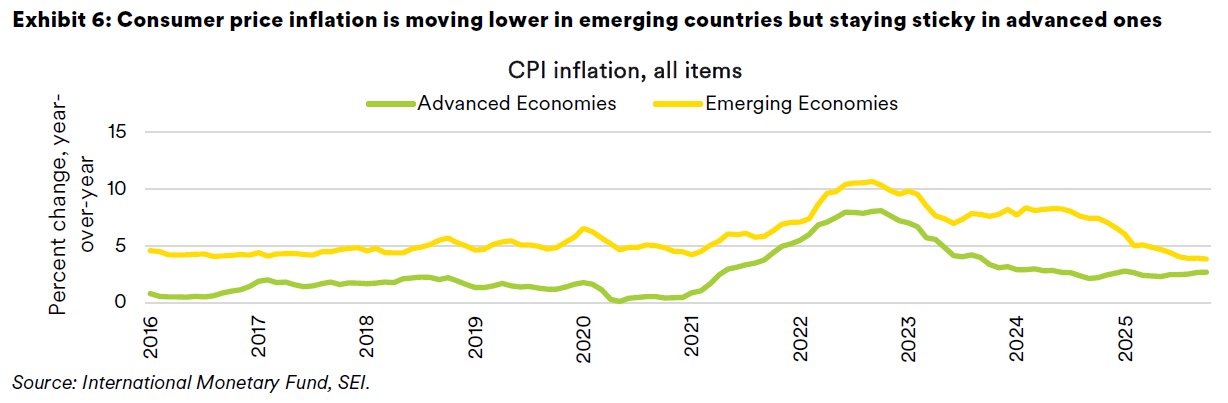
Global inflation improved by more than we expected in 2025. Exhibit 6 tracks the year-over-year inflation rates for both advanced and developing countries, weighted by the size of their economies on a purchasing-power parity basis. Note the strong disinflationary trend in the emerging and developing economies. In the past two years, emerging economies have enjoyed a sharp decline in their overall inflation rate, from around 8% at the start of 2024 to less than 4% as of October 2025. A good part of this improvement could be chalked up to lower food prices that make up a sizeable portion of the developing world’s goods basket. China and India’s most recent year-over-year readings are near zero. Several countries in South America have recorded notable improvements in their inflation rates, with Chile, Mexico and Peru below the developing-world average. Developed economies still have a lower inflation rate, but the differential with emerging economies has narrowed considerably. Consumer-price inflation as of October in the developed world is currently near the same level (+2.7% on a year-over-year basis) as it was two years ago. The inflation rate has reaccelerated since hitting 2.3% in May. The U.K. and Japan are still posting year-over-year consumer-price index (CPI) gains of 3% or higher. The U.S. recorded a surprisingly sharp year-over-year deceleration in its CPI for November, to 2.7% from 3.0% as recently as September. Most economists are dismissing the November CPI report because much of the data was collected just as holiday discounting kicked in at the end of the month. In addition, housing costs may have been underestimated. SEI reckons underlying consumer-price inflation in the U.S. is still running near 3%.
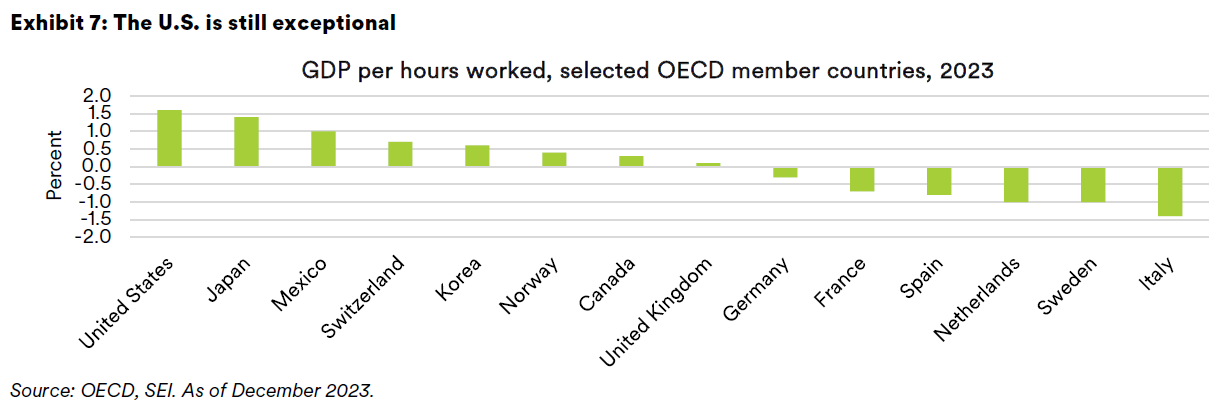
Services inflation remains a problem for the largest developed economies. Although down from its post-pandemic peak, it is still running hot in most major countries compared to the 2000-to-2020 period. Even the weaker economies of Canada and the eurozone have shown no further improvement in 2025, with overall inflation bottoming out around 2%. This stickiness comes from entrenched factors such as rising labor costs and slow productivity growth. Year-over year wage growth in the U.K. (up 4.7% as of October) and the U.S. (up 3.8% as of November) is still too high to have any confidence that services inflation will fall materially in those two countries. Wage growth is slower in Canada and the eurozone (between 2% and 3%), but productivity growth is quite low. According to the Organisation for Economic Co-operation and Development’s (OECD) recent study on productivity that we highlight in Exhibit 7, GDP per hours worked grew by 1.6% in the U.S. in 2023 (the latest available data).2 Japan’s productivity rose 1.4% while the European Union (EU), including Germany and France, recorded an outright decline.
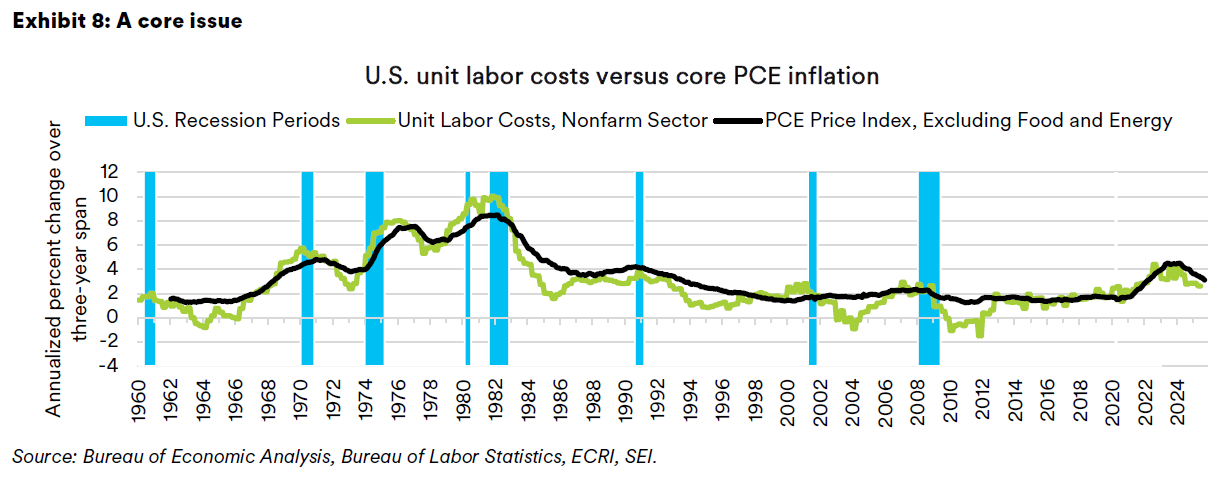
Productivity is the key to getting inflation down on a sustainable basis while allowing labor compensation to grow ahead of inflation. Exhibit 8 tracks the trend in U.S. unit labor costs, which is the difference between the growth in hourly compensation and productivity versus core inflation measured by the personal-consumption price deflator—the Federal Reserve’s (Fed) favorite inflation yardstick. The three-year annualized gain in unit labor costs has eased in recent years, driven down by both a slower rise in compensation per hour and an increase in productivity. Core inflation has not slowed by nearly as much as unit labor costs; corporate profit margins have benefited as a result. SEI thinks U.S. core inflation will fluctuate in a 2.75%-3.25% range in 2026. There is the possibility that inflation will fall below that range if the Supreme Court finds the tariffs imposed under the International Emergency Powers Act (IEEPA) to be unconstitutional. Additionally, the Trump administration could scale back its tariff regime via additional trade deals to address the affordability issue that has become the top concern of voters. In the near-term, though, the tariff increases that have been put in place are still feeding through the economy.
Monetary policy: A changing of the guard
The conduct of monetary policy in 2025 mostly followed SEI’s expectations, with all major central banks except Japan engaging in multiple policy-rate reductions. We agreed with the Federal Open Market Committee’s (FOMC) assessment at the time that the federal funds rate would fall from a beginning-of-the-year level of 4.5% to about 4%. Following December’s reduction, the federal funds rate starts the new year in a range of 3.50% to 3.75%. We thought there was a chance that the Fed would not need to reduce the funds rate at all in 2025; it did drag its feet in doing so until September, intense rhetorical pressure from President Trump notwithstanding.
We did not anticipate how dovish the Bank of England (BOE) would be. The U.K. bank rate started the year at 4.75% and was cut four times to end 2025 at 3.75%. We thought the country’s high and sticky inflation rate would constrain the BOE from cutting more than once or twice. Conversely, the European Central Bank (ECB) was a bit less aggressive than expected in easing the monetary reins. While it did cut the deposit rate four times, from 3% to 2% between February and June, it then held rates steady throughout the rest of the year. The Bank of Canada (BoC) also cut its target rate by a full percentage point over the course of last year, continuing the aggressive series of reductions that began in June 2024 at a peak of 5%. Exhibit 9 clearly shows that central bank policy rates remain well above the levels that marked the period between the 2008-to-2009 global financial crisis and the post-pandemic tightening surge. Japan remains the outlier, raising its policy rate in January 2025 and then again in December.
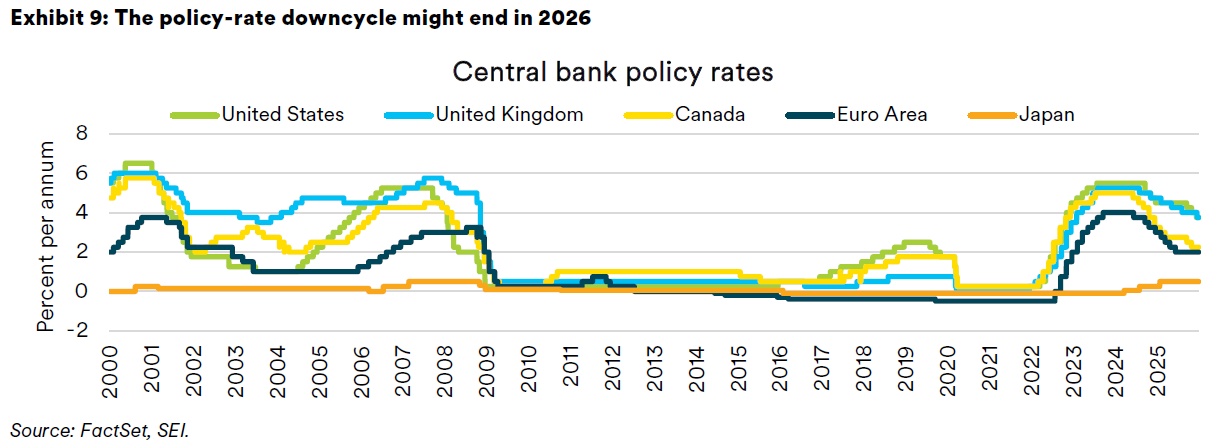
We see limited scope for additional interest-rate reductions by the BoC and the ECB given the relatively low levels that rates have reached. Economic growth will probably still be sluggish, as we noted above, but fiscal policy provides support, and U.S. tariffs are more likely to be reduced from here. In addition, both economies are generally more sensitive to the level of rates compared to the U.S. While some portion of households with mortgages are still facing upward mortgage-rate adjustments, the incremental pain is less than it was one or two years ago. The U.S. and the U.K have more room to reduce rates, but even these central banks may be hesitant to cut them more than one or two times next year. The BOE probably has more room to cut than the Fed as U.K. fiscal policy is tighter and growth is weaker. Despite an uncomfortably high inflation rate, the BOE may deem it necessary to counteract the deflationary impact of tax increases on the economy.
The U.S., meanwhile, continues to exhibit solid growth, and inflation remains materially above the central bank’s target. With more fiscal stimulus coming down the road in early 2026, a wait-and-see attitude appears appropriate. The question is whether the Fed will bend to the wishes of the Trump administration to lower rates more aggressively. Jerome Powell’s tenure as Fed chair ends in May 2026. His term as a Fed governor ends in January 2028. We would be surprised if he decided to stay on as Fed governor after he finishes his term as chair. In any event, Powell’s successor as Fed chair will almost certainly be more sympathetic to President Trump’s view that interest rates are too high and should be lowered. At this point, betting markets are split between Kevin Hassett, who is currently the National Economic Council director, and Kevin Warsh, a former Fed governor. Of the two primary candidates under consideration, Hassett is perceived as the one most likely to do Trump’s bidding.
Fed watchers are concerned that the U.S. central bank will lose its independence. We aren’t as worried for reasons we listed in our previous quarterly economic outlook. The Fed is a proud institution that will lean hard against political pressure if it becomes obvious that further easing would be detrimental to its twin mandates of full employment and low inflation. There’s no denying that these two mandates are currently in some tension. Split views inside the FOMC will need to be thrashed out in the months ahead. But there is no reason to believe that a majority of members will follow the lead of a Fed chair that is pushing a particular point of view for political, rather than economic, reasons.
We think the fears that President Trump will be able to “pack” the Fed are overwrought. His attempt to fire Fed Governor Lisa Cook has yet to be decided by the Supreme Court. But, as is the case with the IEEPA tariffs, precedent does not favor the current administration’s position. Earlier speculation by market observers that the Fed governors based in Washington, DC, would team up to block five regional Fed presidents from renewing their terms has proven unfounded. Finally, even if Governor Cook is forced to resign and Fed Chair Powell steps down in May, the Senate might be less receptive to Trump loyalists when the stakes are so high. The bottom line: There is a case to be made for additional rate cuts by the Fed but the decision-makers at the U.S. central bank are unlikely to throw caution to the wind if there are signs that inflation is reaccelerating or bond-market investors are beginning to panic.
Fiscal policy: Lord, make me chaste—but not yet
Forecasting an expansive fiscal policy for the major economies is the easiest call to make. We did so for 2024 and for 2025 and were not disappointed. SEI is making the same call for 2026, only this time we believe government fiscal policy will be even more expansive. This time last year we noted that the election of Donald Trump and the Republican victories in the House of Representatives and Senate guaranteed the extension of most tax cuts embodied in the 2017 Tax Cuts and Jobs Act (TCJA). We also expected several campaign promises to be enacted, including the elimination of taxes on tips and overtime, tax relief for pensioners, and an easing of the deductibility limit on state and local taxes. The so-called One Big Beautiful Bill Act included all these items plus business breaks in the form of generous rules for depreciation and tax deductions on research and development (R&D) and capital expenditures.
In the U.K., SEI noted that the Labour Party government was pursuing a tax-and-spend policy that placed greater emphasis on the spending side of the equation. The revenue-raising measures turned out to be extremely unpopular. Chancellor of the Exchequer Rachel Reeves is not for turning, however. The unveiling of the latest autumn budget in the U.K. was initially well received by the bond market, but it also marked a continuation of the government’s tax-and-spend policies. A freeze on income-tax and national-insurance thresholds until 2031 will affect millions of earners and raise nearly £13 billion (US$17.6 billion) annually. High-income earners and the affluent will be hurt by an increase in dividend, capital gains, and property taxes. The so-called mansion tax on homes above £2 million (US$2.7 million) seems to be squarely aimed at London and its wealthier suburbs. The abolition of the two-child benefit cap (effective April 2026) is the most important relief item in the budget and should improve household income for some 500,000 families. The overall tax burden will rise to a record 38% of GDP by 2030 because of these changes; the economic impact probably will feel just more of the same.
The new federal budget in Canada for fiscal year 2025-2026 represents nearly a doubling from the previous budget’s red-ink total but still amounts to only 2.5% of GDP. The government has abandoned its prior debt-to-GDP ratio target, allowing federal debt to rise in the near term. Canada’s federal debt-to-GDP ratio is now expected to increase into the mid-40% range before stabilizing. Previously, the fiscal anchor pointed toward a declining debt ratio; projections from earlier this year had the debt burden peaking at around 42% and then falling below 40% by decade’s end. Lowering the debt ratio is no longer an explicit goal. The larger deficit is primarily a result of higher spending. The government introduced over C$140 billion (US$102.4 billion) in new initiatives to be funded over a five-year period—major investments in infrastructure, defense, industry support, and housing—while anticipated savings from cost cutting is expected to fall short compared to previous assumptions. On the revenue side, measures such as tax incentives and the impact of a weaker economy have lowered projected revenues. In short, Ottawa is prioritizing “nation-building” investments and economic stimulus over immediate fiscal consolidation, aiming to offset costs through efficiency savings and by reclassifying long-term investments in a separate capital budget. Although the government projects fiscal consolidation in the years ahead, there is no guarantee those savings will be realized. The eurozone and Japan are likely to see increased fiscal expansion in the year ahead as well, with Germany no longer constrained by its debt brake, France in a political quagmire, and Japan’s new government intent on stimulating its economy despite unusually elevated inflation pressures.
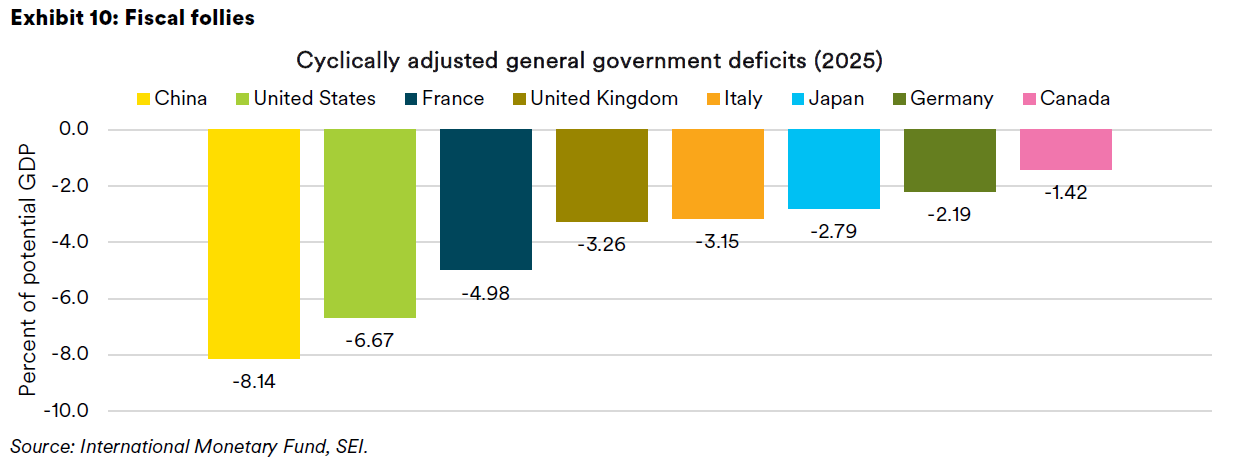
Exhibit 10 highlights the cyclically adjusted general government deficits for the Group of Seven (G7) countries plus China. This includes the combined fiscal position of both federal and provincial/states/local governments. It is adjusted for the impact of the economic cycle on revenues and expenses. China, the U.S., and France stand out on this measure, but Germany, Italy, and France are each running cyclically adjusted deficits that are considerably worse compared to their own history over the past 25 years.
A common theme is the political shift favoring populist/anti-austerity parties leading to looser fiscal policy. Leaders respond to voter discontent over inequality, stagnation, and the cost of living with more public spending or tax cuts, not austerity. Increased spending on pensions and healthcare is on automatic pilot. Meanwhile, there is a pressing need to raise defense expenditures quickly and forcefully at a time when the U.S. is questioning its role as the world’s police officer.
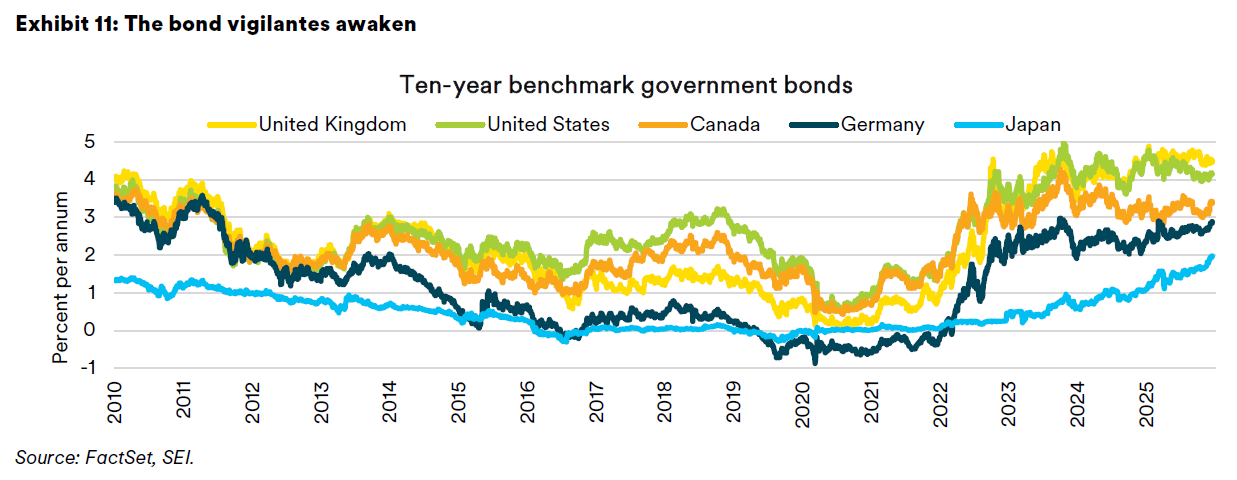
Exhibit 11 tracks the bond yields of the U.S., U.K., Canada, Germany, and Japan. The U.S. and U.K. bond yields are meaningfully higher, reflecting their higher inflation rates. But the other three countries, particularly Japan, have recorded sharply rising 10-year government yields in the past two months. We suspect that investors are growing nervous about the longer-term fiscal outlook in those three countries.
Geopolitics: A safer world—for now
Although we accurately predicted some of the major geopolitical developments of 2025, the world finished the year in a less volatile place than we would have thought. The conflict between Ukraine and Russia dragged on as expected. Our prediction that the two sides might come to the negotiating table, prodded by President Trump, also came to fruition. Unfortunately, the two sides remain far apart, and Ukraine’s leverage appears to be fading as the nasty war of attrition continues and Trump presses the country hard to accept unfavorable terms. A scandal that reached the highest levels of Ukraine’s government also imperils President Volodymyr Zelensky’s position. President Trump has signaled in no uncertain terms that his administration is losing patience, although the U.S. has continued to provide weapons paid for by the European members of NATO. After much debate, Europe has managed to agree to lend more money to Ukraine that should allow the country to keep fighting through 2026 and into 2027. War and negotiations between the two Eastern European countries are likely to drag on, with military developments determining the pace and seriousness of the peace discussions.
This time last year, the war between Israel and Hamas also appeared to have entered its final stages. Hamas found itself increasingly isolated, following the surprise collapse of the Assad regime in Syria and a weakened Hezbollah reaching a tentative peace deal with the Israelis. One major development during 2025 was the brief 12-day war between Israel and Iran. It resulted in a devastating defeat for Iran, with its nuclear program severely degraded following the American bombing attack. To be sure, hostilities continue at a relatively low level. But we believe the war is winding down and expect attention to shift toward efforts to rebuild and reduce the misery of the Gazan population. The Trump administration’s close economic relationship with Saudi Arabia and other countries in the area should smooth the way for an eventual diplomatic solution.
Regarding China-U.S. relations, SEI correctly projected that tensions would continue to rise as the two countries engage in a tit-for-tat trade war. At one point, the tariff war threatened to throttle trade completely between the countries. China’s temporary banning of rare-earth mineral exports (a group of metals that are used in the production of cars, electronics and military equipment) forced the U.S. to back off its maximalist tariff position. There now seems to be an effort on both sides to lower the temperature, which is a positive development. In the coming year, we expect tensions to fluctuate over trade, Taiwan, and China’s support for Russia. As we previously noted, China currently is stoking tensions with Japan over comments made by the new Japanese prime minister about the need for Japan to build up its military preparedness. We do not see any outbreak in hostilities beyond heated rhetoric and boycotts of products and reduced tourism.
A new flashpoint is in South America, where the U.S. overthrew the Maduro regime, extraditing both Maduro and his wife to the United States to face drug trafficking charges. President Trump announced that he will be “running” the country while the country’s dilapidated oil facilities are rebuilt and until a new government can be installed. It remains to be seen how this will all play out. The broader strategy appears aimed at increasing American power and influence in South and Central America while reducing the influence of China. It also highlights the Trump Administration’s determination to use military force against the drug cartels. One cannot rule out the possibility that Trump will pressure other countries, such as Colombia and Mexico, to take a tougher approach to the cartels if they want to avoid the sort of military intimidation used by the U.S. ahead of the actual invasion of Venezuela.
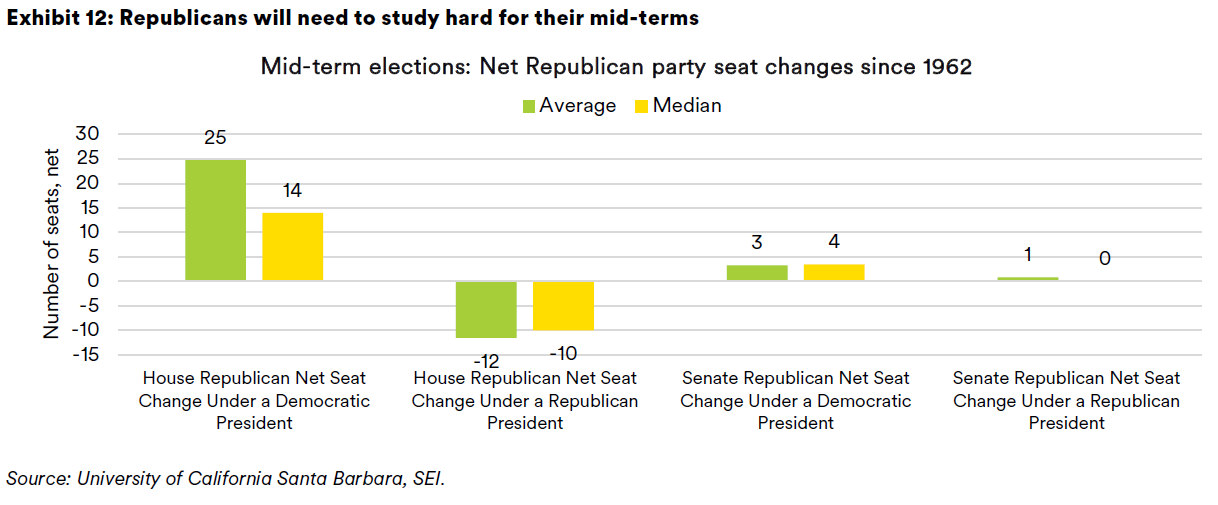
None of the above is expected to have a major market impact, although the oil markets could turn more volatile if further sanctions are placed on Russian oil or the occupation of Venezuela takes a bad turn. Investors may instead pay more attention to the political calendar. The U.S. holds mid-term elections in November. All 435 seats in the House of Representatives and 35 of the 100 Senate seats are up for election (including two special Senate elections to fill unexpired terms). There are also 39 state governor positions to be contested. Their slim majority in the House suggests that the Republicans will have difficulty maintaining control of that chamber. The sitting president’s party historically loses seats in the mid-terms, as illustrated in Exhibit 12. The recent off-year elections were likely a wake-up call for the Republican Party; their gubernatorial candidates underperformed in Virginia and New Jersey, while lower-level elected positions also swung decisively toward the Democrats. Affordability, inflation, and healthcare expenses are currently the major issues influencing the electorate. President Trump’s approval ratings are also quite low. While the mid-term elections are still 11 months away, the early read is not a positive one for the Republicans. Democratic control of the House can be expected to lead to policy gridlock and constant clashes with the Trump administration.
Investor sentiment: Surprisingly neutral
We believed that investor sentiment was overly positive at the start of the year but this ebullience was tamped down by the U.S. tariff war and concerns about growing levels of capital expenditures in the technology sector. There is no denying that valuations are elevated in certain areas of the equity and fixed-income markets. Credit spreads are tight, and the price-to-earnings (P/E) multiple on large-cap stocks in the U.S. (as measured by the S&P 500 Index) currently amounts to 22 times the estimated per-share earnings forecast one year out. The so-called Magnificent Seven companies sport a P/E ratio of 29; while down from the nosebleed levels of more than 35 times reached in 2020 and 2021, that valuation is still historically high.
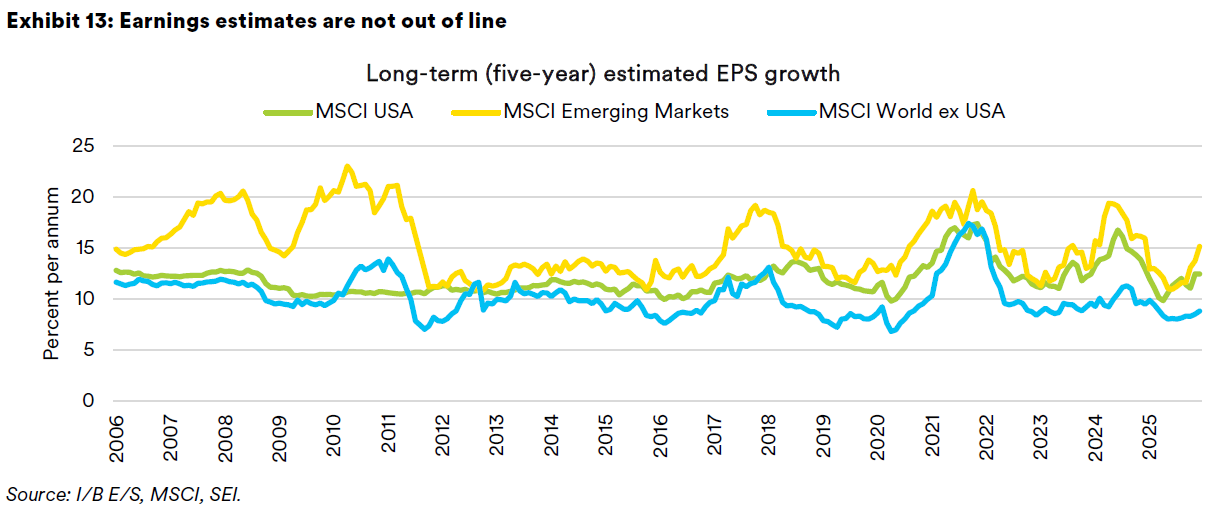
Beyond the S&P 500 Index, valuations remain far more reasonable. The S&P MidCap 400 Index and the S&P SmallCap 600 Index have forward P/Es of 16.3 and 15.5, respectively. Both are well within the historical range of the past two decades. The same goes for international equities. The MSCI World ex USA Index trades at a 15.7 P/E multiple while the MSCI Emerging Markets Index has a forward P/E ratio of 13.5. The P/E multiple discount of international stocks versus those of the U.S. has narrowed somewhat this year but is still substantial. Of course, U.S. growth in earnings has been phenomenal, and analysts are willing to forecast a continuation of 12.5% growth annually over the next five years. By contrast, analysts’ long-term growth estimates for the companies that comprise the MSCI World ex USA Index remain quite subdued, nearing the lowest levels since the pandemic with a reading of 8.9%. The estimated long-term earnings growth rate for emerging markets has rebounded this year; the Institutional Brokers' Estimate System’s (I/B/E/S) estimates for the next five years are pegged at 16.5% and rising. As highlighted in Exhibit 13, long-term earnings-per-share (EPS) growth estimates do not seem unreasonably optimistic relative to the past two decades.
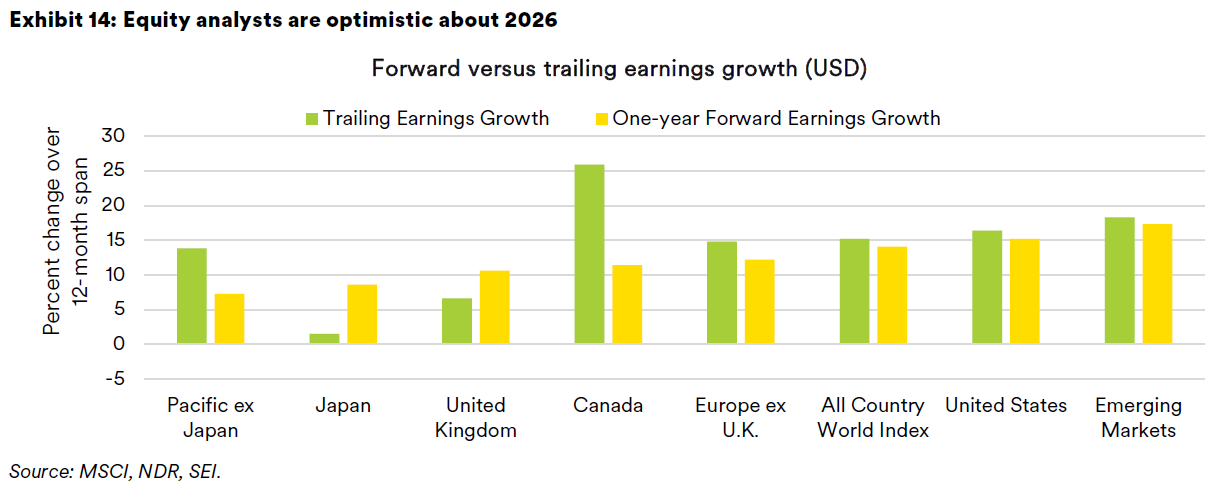
As we highlight in Exhibit 14, security analysts expect U.S. EPS to grow by 15.2% over the 12 months ended December 2026 versus a reported EPS gain of 15.6% for the trailing 12-month period. Japan and the U.K. are expected to show the biggest improvement (measured in U.S. dollars). Forward earnings in emerging markets should remain healthy with an estimated gain of 17.3%, albeit a slight deceleration from the 12-month advance posted in over the trailing 12 months ended December. Apart from companies that comprise the MSCI Japan Index and the MSCI Pacific ex-Japan Index, other regions are predicted to post double-digit earnings growth in 2026 versus the past year.
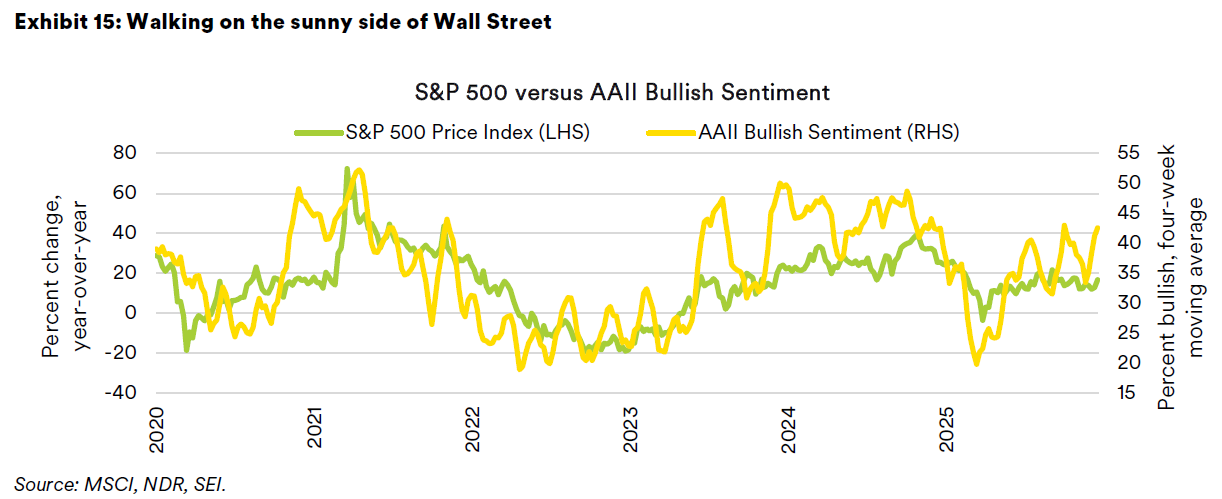
Although market observers worry that individual investors are overly optimistic (investor sentiment is used by equity strategists as a contrarian indicator), sentiment surveys do not appear terribly worrisome. Exhibit 15 tracks bullish sentiment, as measured by the American Association of Individual Investors (AAII), compared to the year-on-year change in the S&P 500 Index stock prices. It should not surprise anyone that bullish sentiment is positively correlated with the performance of the stock market. When equity performance is strong, bullish sentiment tends to be high. Bulls were hard to find at the bottom of the market correction in 2022, but they suddenly emerged in 2023 and 2024 as the market roared ahead on the strength of AI plays.
Bullishness peaked right after the November 2024 elections and then collapsed as President Trump ramped up his trade wars against Canada, Mexico, and other countries early in 2025. Sentiment has since been volatile but mostly below the euphoric levels that raised our concerns in 2023 and 2024.
Other measures of investor sentiment also provide a mixed picture. Technical and investor sentiment signals that are in neutral territory include the equity put-to-call ratio, the net position of traders in S&P futures (large speculators are notably bearish, while small traders are moderately bullish), and short interest as a percentage of daily trade volume on the New York Stock Exchange. On the negative side, volatility across different assets—stocks, bonds and foreign exchange—is notably low, indicating a high degree of investor complacency. However, with benign financial conditions and robust earnings growth, there is probably more life left in this “old bull” as we head into 2026. To get insights into SEI’s investment positioning, please read Chief Investment Officer Jim Smigiel’s SEI Forward report.
2026 Economic outlook: Key themes
- U.S. growth leadership expected to continue: The U.S. is projected to remain the standout performer among developed economies, with momentum from strong consumer spending and ongoing investment in AI and technology infrastructure.
- Global growth divergence: The eurozone is expected to see an uptick in growth in 2026, supported by fiscal stimulus and low interest rates. In contrast, the U.K. may experience further slowing due to tighter fiscal policy and elevated inflation. Canada faces another challenging year, with tough USMCA trade negotiations ahead.
- Trade policy uncertainty: U.S.-Canada trade relations will be tested as the USMCA treaty comes up for review. The Supreme Court will decide whether the reciprocal tariffs are constitutional; a ruling against the Trump administration’s position would reduce goods inflation but sharply cut government revenues and increase the deficit.
- Demographic shifts: By 2050, major economies, including China, Japan, and South Korea, will see significant declines in their working-age populations, while the U.S., U.K., and Canada are expected to register gains—assuming continued immigration and stable fertility rates.
- Inflation outlook: U.S. core inflation is forecast to fluctuate in the 2.75%–3.25% range in 2026. There is potential for lower inflation if tariffs are scaled back or found unconstitutional, but near-term pressures remain owing to recent tariff increases.
- Monetary policy: Central banks have limited room for further rate cuts. The BOE may cut rates to counteract the deflationary effects of tax increases, while the Fed’s future direction could be influenced by a new Fed chair more sympathetic to the administration’s views.
- Fiscal expansion: Fiscal policy is expected to be even more expansive in 2026 in the U.S., Canada, the U.K, Europe and Japan.
- Geopolitical risks: Ongoing conflicts (Ukraine-Russia, U.S.-Venezuela) and trade tensions (U.S.-China, U.S.-Canada) will continue to shape the global landscape but are not expected to cause major market disruptions unless oil markets become more volatile.
- Investor sentiment: Analysts expect robust earnings growth in 2026; earnings in emerging markets remain healthy, though sentiment is tempered by political and economic risks.
- Political calendar: The U.S. mid-term elections in November 2026 could lead to even worse policy gridlock in 2027 if the Democrats regain control of the House.
A personal note from Jim Solloway:
I would like to take this opportunity to announce my departure from SEI effective February 6th. I want to thank my colleagues for all they have done for me during my tenure, and I especially want to thank SEI’s clients for welcoming me into their investment discussions. I truly enjoyed my 17 years here and I wish you all the very best.
GLOSSARY AND INDEX DEFINITIONS
For financial term and index definitions, please see: https://www.seic.com/ent/imu-communications-financial-glossary.
IMPORTANT INFORMATION
This material represents an assessment of the market environment at a specific point in time and is not intended to be a forecast of future events, or a guarantee of future results. Positioning and holdings are subject to change. All information as of the date indicated. There are risks involved with investing, including possible loss of principal. This information should not be relied upon by the reader as research or investment advice, (unless you have otherwise separately entered into a written agreement with SEI for the provision of investment advice) nor should it be construed as a recommendation to purchase or sell a security, including futures contracts. The reader should consult with their financial professional for more information.
Statements that are not factual in nature, including opinions, projections and estimates, assume certain economic conditions and industry developments and constitute only current opinions that are subject to change without notice. Nothing herein is intended to be a forecast of future events, or a guarantee of future results.
Certain economic and market information contained herein has been obtained from published sources prepared by other parties, which in certain cases have not been updated through the date hereof. While such sources are believed to be reliable, neither SEI nor its affiliates assumes any responsibility for the accuracy or completeness of such information and such information has not been independently verified by SEI.
There are risks involved with investing, including loss of principal. The value of an investment and any income from it can go down as well as up. Investors may get back less than the original amount invested. Returns may increase or decrease as a result of currency fluctuations. Past performance is not a reliable indicator of future results. Investment may not be suitable for everyone.
Diversification does not ensure a profit or guarantee against a loss. International investments may involve risk of capital loss from unfavorable fluctuation in currency values, from differences in generally accepted accounting principles or from economic or political instability in other nations. Emerging markets involve heightened risks related to the same factors as well as increased volatility and lower trading volume. Narrowly focused investments and smaller companies typically exhibit higher volatility. Bonds and bond funds will decrease in value as interest rates rise. High-yield bonds involve greater risks of default or downgrade and are more volatile than investment-grade securities, due to the speculative nature of their investments.
Index returns are for illustrative purposes only and do not represent actual portfolio performance. Index returns do not reflect any management fees, transaction costs or expenses. One cannot invest directly in an index.
This material is not directed to any persons where (by reason of that person's nationality, residence or otherwise) the publication or availability of this material is prohibited. Persons in respect of whom such prohibitions apply must not rely on this information in any respect whatsoever.
The information contained herein is for general and educational information purposes only and is not intended to constitute legal, tax, accounting, securities, research or investment advice regarding the strategies or any security in particular, nor an opinion regarding the appropriateness of any investment. This information should not be construed as a recommendation to purchase or sell a security, derivative or futures contract. You should not act or rely on the information contained herein without obtaining specific legal, tax, accounting and investment advice from an investment professional.
SEI sources data directly from FactSet, Lipper, and BlackRock unless otherwise stated.
Information provided by SEI Investments Management Corporation, a wholly owned subsidiary of SEI Investments Company (SEI). They should not be construed as investment advice.
Information issued in the UK by SEI Investments (Europe) Limited, 1st Floor, Alphabeta, 14-18 Finsbury Square, London EC2A 1BR which is authorised and regulated by the Financial Conduct Authority. Investments in SEI Funds are generally medium- to long-term investments.
This document has not been registered by the Registrar of Companies in Hong Kong. In addition, this document may not be issued or possessed for the purposes of issue, whether in Hong Kong or elsewhere, and the Shares may not be disposed of to any person unless such person is outside Hong Kong, such person is a “professional investor” as defined in the Ordinance and any rules made under the Ordinance or as otherwise may be permitted by the Ordinance.
The contents of this document have not been reviewed by any regulatory authority in Hong Kong. You are advised to exercise caution in relation to the offer. If you are in any doubt about any of the contents of this document, you should obtain independent professional advice.
This information is made available in Latin America and the Middle East FOR PROFESSIONAL (non-retail) USE ONLY by SIEL.
Any questions you may have in relation to its contents should solely be directed to your Distributor. If you do not know who your Distributor is, then you cannot rely on any part of this document in any respect whatsoever.
Issued in South Africa by SEI Investment (South Africa) (Pty) Limited FSP No. 13186 which is a financial services provider authorised and regulated by the Financial Sector Conduct Authority (FSCA). Registered office: 3 Melrose Boulevard, 1st Floor, Melrose Arch 2196, Johannesburg, South Africa.
This material is intended for information purposes only and the information in it does not constitute financial advice as contemplated in terms of the Financial Advisory and Intermediary Services Act.
SIEL is not licensed under Israel’s Regulation of Investment Advising, Investment Marketing and Portfolio Management Law, 5755-1995 (the “Advice Law”) and does not carry insurance pursuant to the Advice Law. No action has been or will be taken in Israel that would permit a public offering or distribution of the SEI Funds mentioned in this email to the public in Israel. This document and any of the SEI Funds mentioned herein have not been approved by the Israeli Securities Authority (the “ISA”).
The views contained herein are not to be taken as advice or a recommendation to buy or sell any investment in any jurisdiction. Our outlook contains forward-looking statements that are judgments based upon our current assumptions, beliefs, and expectations. If any of the factors underlying our current assumptions, beliefs or expectations change, our statements as to potential future events or outcomes may be incorrect. We undertake no obligation to update our forward-looking statements.


