Putting 2018 in Perspective
Despite a strong start to the year, capital markets finished 2018 with an intense bout of volatility and risk aversion. Broad-based selloffs in the fourth quarter erased gains accumulated across most asset classes earlier in the year and pushed equity markets into negative territory for the year. Exhibit 1 depicts the extent of this selloff—with risk assets trending steadily down during the fourth quarter, having few places to hide.
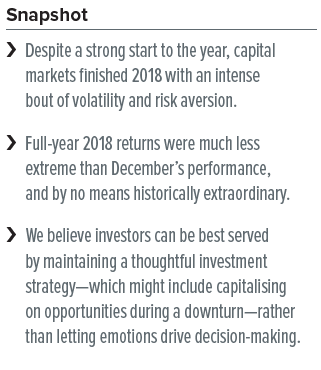
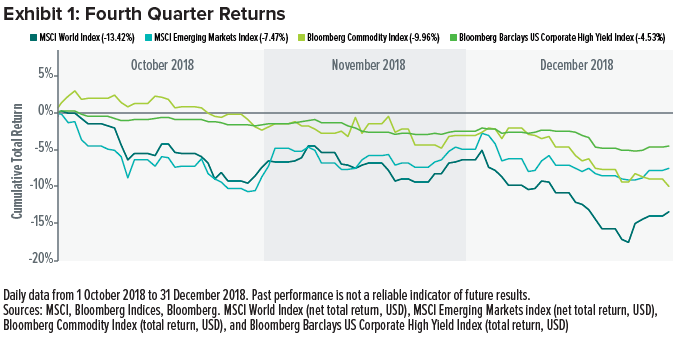
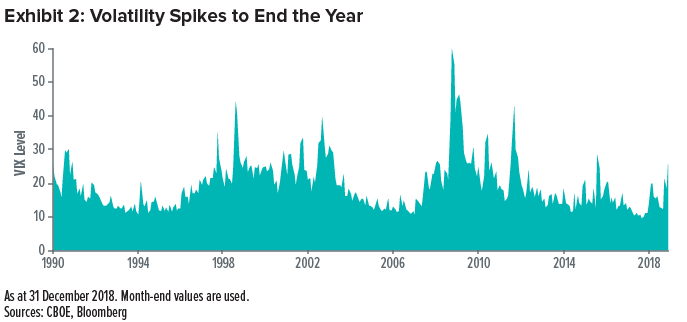
Exhibit 2 illustrates the tumult, as measured by the so-called fear index—Chicago Board of Options Exchange Volatility Index (VIX)—which surged to 25 from 12 over the fourth quarter, exemplifying the market’s forward-looking volatility expectations.
“The Worst December since the Great Depression”
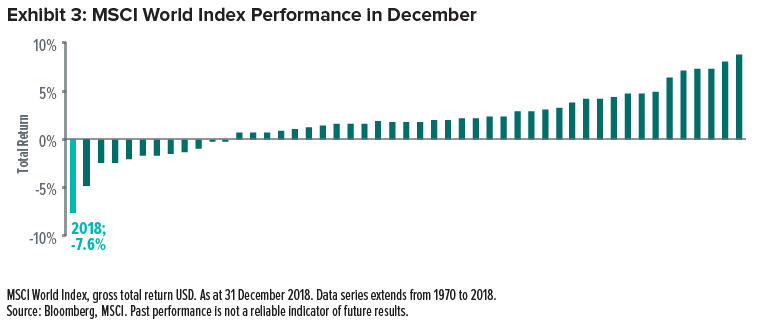
The year concluded with attempts by the financial press to portray the market downturn as one for the ages. The most notable of these reports centred on the S&P 500 Index, which represents U.S. companies with large market capitalizations, registering the “worst December since the Great Depression.”1 Global equity indexes were hit similarly, with the MSCI World Index registering its worst December on record (dating back to 1970), as shown in Exhibit 3.
Headlines making these claims failed to convey necessary context for understanding the December (and fourth-quarter) plunge—grossly overselling the extent of the market decline.
Global equities (as measured by the MSCI World Index) were actually performing above average heading into the fourth quarter before volatility struck in October. As Exhibit 4 demonstrates, performance was much less extreme for the full calendar year than during December and the fourth quarter, and by no means historically extraordinary.
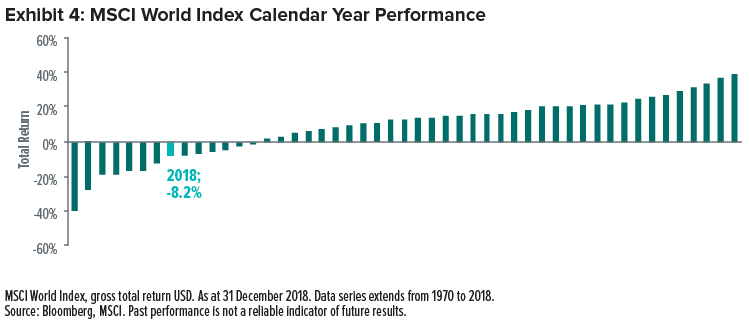
In fact, when limiting our focus to monthly returns since the turn of the century, the most recent December decline appears unlikely but not unprecedented (with a standard deviation 2 of 1.4, assuming an annual volatility of 20.5% based on our latest Capital Market Assumptions). Since 2000, there have been 13 months with softer total returns—they just happened to not be Decembers.
The Outlier That Was 2017
The dislocation at the end of 2018 may have felt particularly outsized because it occurred amid an unusually long period of volatility. Looking back to Exhibit 2, it’s plain to see that expected volatility measures escalated in the fourth quarter to the highest sustained levels in several years. But in a longer-term context, this was not abnormal. Year-end volatility was nowhere near that of the financial crisis of 2008 or dotcom crash in 2000; it was more akin to the minor market correction we saw at the start of 2016.
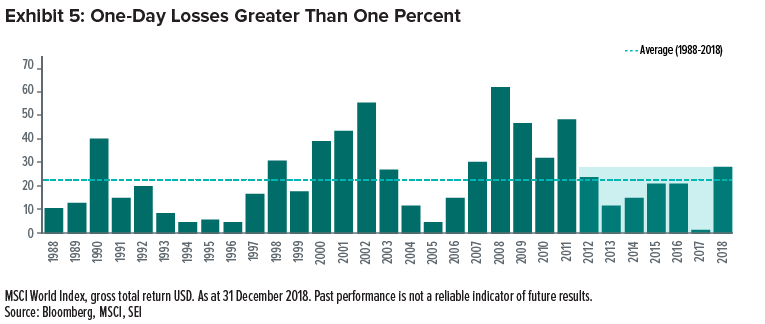
This point is illustrated in Exhibit 5, which shows the number of daily one-percent price declines in each of the past thirty years. There was a large jump in single-day declines from 2017 to 2018, but the outlier was not the instability of 2018—it was the notable calm of 2017. Last year’s turbulence was more of a return to normal equity-market behaviour than a sign of looming crisis. And while many of its one-percent-decline days occurred in the fourth quarter, such clustering is not unusual. Since 2000, there have been nine other quarters with at least as many one-percent-decline days.
“The Time to Buy Is When There’s Blood in the Streets”
Baron Rothschild, 18th century British nobleman and member of the legendary Rothschild family banking dynasty, reportedly said, “The time to buy is when there’s blood in the streets.”3 No, we do not see last quarter’s weakness as a sign of equity prices haemorrhaging to the point of recession, drowning Wall Street with figurative blood. However, in light of the recent volatility, this quote is a good reminder that investors can be best served by maintaining a thoughtful investment strategy—which might include capitalising on opportunities during a downturn—rather than letting emotions drive decision-making.
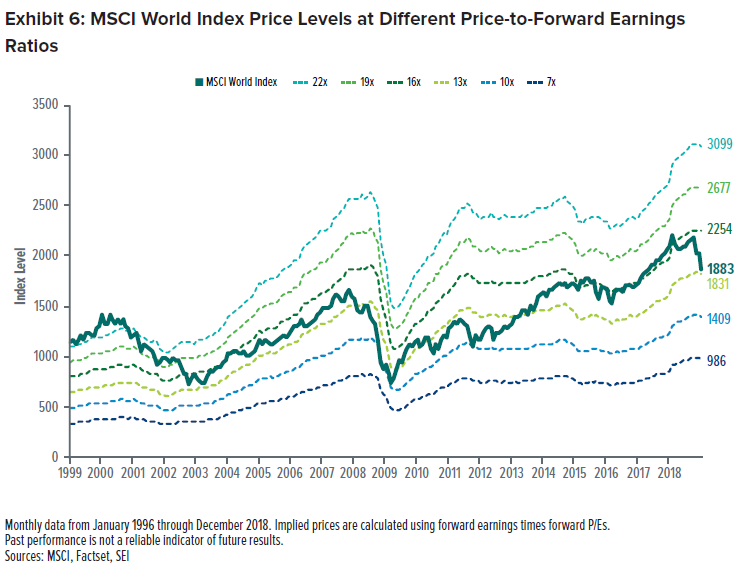
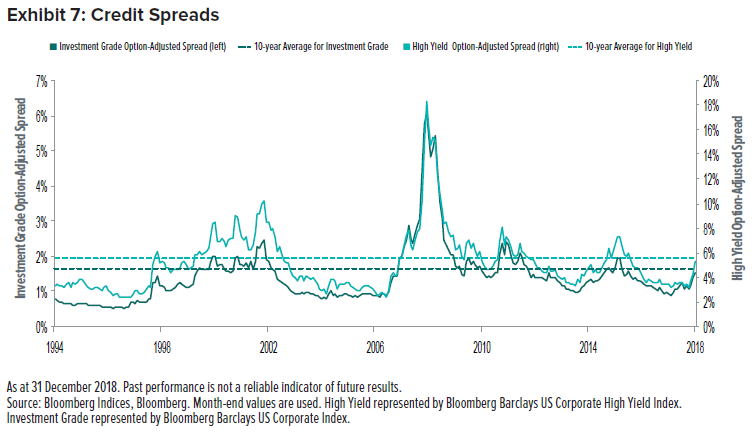
Market selloffs are often called corrections for a reason: When prices “correct,” they’re pulling back from overpriced or inflated levels to more moderate values that are less likely to swell into a bubble that eventually bursts. Even with the recent earnings boom over the past few years, equity multiples continued to climb as price increases far surpassed earnings growth. Meanwhile, investment-grade and high-yield credit spreads both remained historically tight, offering investors minimal compensation (by historical standards) for taking on extra risk. As we see in Exhibits 6 and 7, the fourth quarter of 2018 served as a release valve of sorts, allowing risk-asset valuations across capital markets to settle at more moderate levels—and, as equity valuations pulled back, credit spreads neared their 10-year averages.
Looking forward, we are beginning to see mixed signals about where we are in the economic cycle; we still expect the global economy to continue expanding in 2019, albeit at a moderating pace. The challenging conditions seen in the final quarter of 2018 can prey on investors’ emotions. But the global economy is not exactly in dire straits, and we believe most markets have now corrected to more attractive valuation levels.
Our confidence is increasing that risk assets bottomed in late December. The sheer ferocity of the recent correction is reminiscent of other times in the past eight years when stocks sold down hard, only to turn around and hit new highs. Expected MSCI World Index earnings growth for 2019 remain in the mid-single-digits as of late January, leading us to believe that—barring a collapse in multiples or a major black swan event—2019 may be another solid year.
Putting 2018 in Perspective: Keeping a Strategic Mindset
While examining the volatile capital markets of 2018 can provide useful insight, it is important to maintain perspective and remember to keep in mind the broader historical context. We believe that any reactionary, wholesale changes to a long-term game plan are not only ineffective, but potentially harmful, to an investor’s ability to achieve long-term goals. In our view, strategic allocations should be considered a permanent—or at least durable—core positioning designed to help produce well-diversified, efficient portfolios. These allocations can be tailored to an investor’s ability (including time horizon) and willingness to take risk (if applicable), with the ultimate goal of meeting long-term investment objectives.
In our December 2018 paper, The global bull market: Is it time to get out?4, we examined how timing the market successfully requires, at a minimum, two well-timed decisions (when to exit and when to re-enter), both of which pose risks to meeting long-term investment objectives if poorly timed. That being said, there is a meaningful degree of activity occurring under the hood in many of our solutions as we believe that prudent active management can improve a strategy’s results. Sub-advisors in SEI’s actively managed strategies engage in active security selection and seek to exploit excess return sources, such as value, momentum and stability characteristics (factors); in some cases, our portfolio managers implement active tilts among these factors; and our Portfolio Strategies Group engages in active (or tactical) asset allocation. Tactical allocation positions can be thought of as temporary, as we expect them to be unwound at some point. These changes are marginal adjustments, implemented in a way that avoids overwhelming the strategic characteristics of a portfolio, but are still expected to enhance the return of a strategic portfolio or lower its risk at the margins.
Glossary of Financial Terms
Black swan event: A black swan event is an occurrence that deviates beyond what is normally expected of a situation and that would be extremely difficult to predict.
Factors: Factors, or risk factors, are characteristics of securities (such as momentum, stability or value) that can be periodically under- or over-priced, resulting in temporarily larger or smaller risk premiums.
Forward price-to-earnings ratio: The forward price-to-earnings ratio is the ratio of a company’s share price to its expected earnings over the next 12 months, which can be used to help determine whether a stock is undervalued or overvalued.
Momentum: Momentum securities are those whose prices are expected to keep moving in the same direction (either up or down) and are not likely to change direction in the short-term.
Option-adjusted spreads: Option-adjusted spreads estimate the difference in yield between a security or collection of securities and comparable Treasurys after removing the effects of any special features, such as provisions that allow an issuer to call a security before maturity.
Stability: Stability securities exhibit lower risk and higher quality, and can benefit from the power of long-term compounding as a result of the investors tendency to misprice lower risk.
Value: Value securities are those that are considered to be cheap and are trading for less than they are worth.
Index Definitions
The Bloomberg Barclays U.S. Corporate Index is a broad-based benchmark that measures the investment-grade, fixed-rate, taxable corporate bond market.
The Bloomberg Barclays US Corporate High Yield Bond Index measures the USD-denominated, high yield, fixed-rate corporate bond market.
The Bloomberg Commodity Index reflects commodity futures price movements. The index rebalances annually weighted 2/3 by trading volume and 1/3 by world production and weight-caps are applied at the commodity, sector and group level for diversification.
The Chicago Board Options Exchange Volatility Index (VIX) tracks the expected volatility in the S&P 500 Index over the next 30 days. A higher number indicates greater volatility.
The MSCI Emerging Markets Index is a free float-adjusted market-capitalization-weighted index designed to measure the performance of global emerging-market equities.
The MSCI World Index is a free float-adjusted market-capitalization-weighted index designed to measure the equity market performance of developed markets.
The S&P 500 Index is a capitalization-weighted index made up of 500 widely held U.S. large-cap companies.
Important Information
Data refers to past performance. Past performance is not a reliable indicator of future results.
Investments in SEI Funds are generally medium- to long-term investments. The value of an investment and any income from it can go down as well as up. Investors may get back less than the original amount invested. Returns may increase or decrease as a result of currency fluctuations. Additionally, this investment may not be suitable for everyone. If you should have any doubt whether it is suitable for you, you should obtain expert advice.
No offer of any security is made hereby. Recipients of this information who intend to apply for shares in any SEI Fund are reminded that any such application may be made solely on the basis of the information contained in the Prospectus. This material represents an assessment of the market environment at a specific point in time and is not intended to be a forecast of future events, or a guarantee of future results. This information should not be relied upon by the reader as research or investment advice regarding the funds or any stock in particular, nor should it be construed as a recommendation to purchase or sell a security, including futures contracts.
In addition to the normal risks associated with equity investing, international investments may involve risk of capital loss from unfavourable fluctuation in currency values, from differences in generally accepted accounting principles or from economic or political instability in other nations. Bonds and bond funds are subject to interest rate risk and will decline in value as interest rates rise. High yield bonds involve greater risks of default or downgrade and are more volatile than investment grade securities, due to the speculative nature of their investments. Narrowly focused investments and smaller companies typically exhibit higher volatility.
SEI Funds may use derivative instruments such as futures, forwards, options, swaps, contracts for differences, credit derivatives, caps, floors and currency forward contracts. These instruments may be used for hedging purposes and/or investment purposes.
While considerable care has been taken to ensure the information contained within this document is accurate and up-to-date, no warranty is given as to the accuracy or completeness of any information and no liability is accepted for any errors or omissions in such information or any action taken on the basis of this information.
This information is issued by SEI Investments (Europe) Limited, 1st Floor, Alphabeta, 14-18 Finsbury Square, London EC2A 1BR which is authorised and regulated by the Financial Conduct Authority. Please refer to our latest Full Prospectus (which includes information in relation to the use of derivatives and the risks associated with the use of derivative instruments), Key Investor Information Documents and latest Annual or Semi-Annual Reports for more information on our funds. This information can be obtained by contacting your Financial Adviser or using the contact details shown above.
SEI sources data directly from FactSet, Lipper, and BlackRock, unless otherwise stated.
The opinions and views in this commentary are of SEI only and should not be construed as investment advice.


