Monthly Market Commentary: Markets caught in a downpour as rates spring up.
April’s market action extended the trends that shaped the first quarter. Equities and bonds tumbled, while commodities climbed.
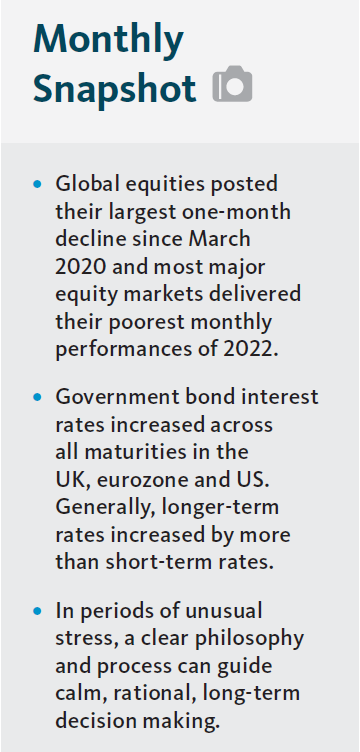
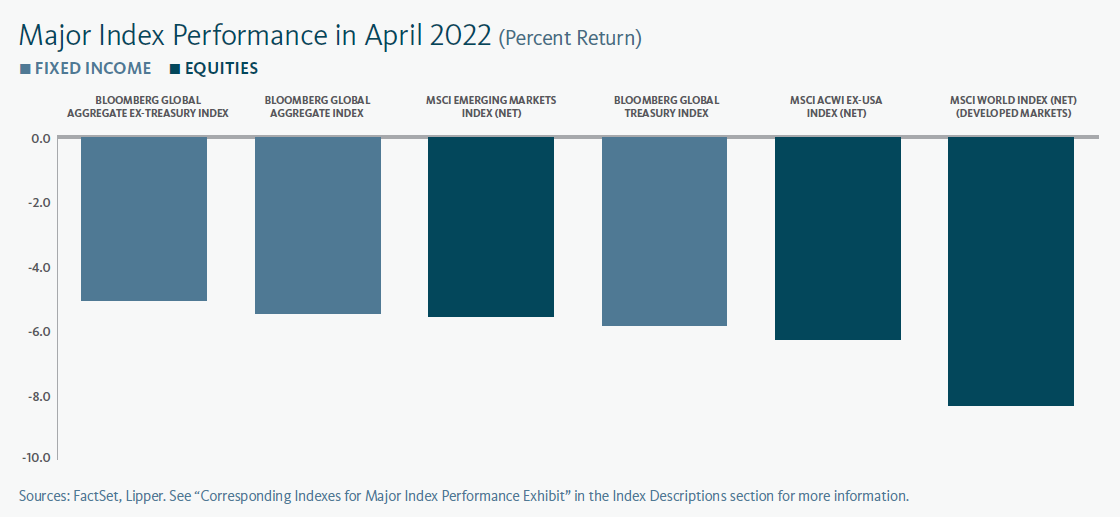
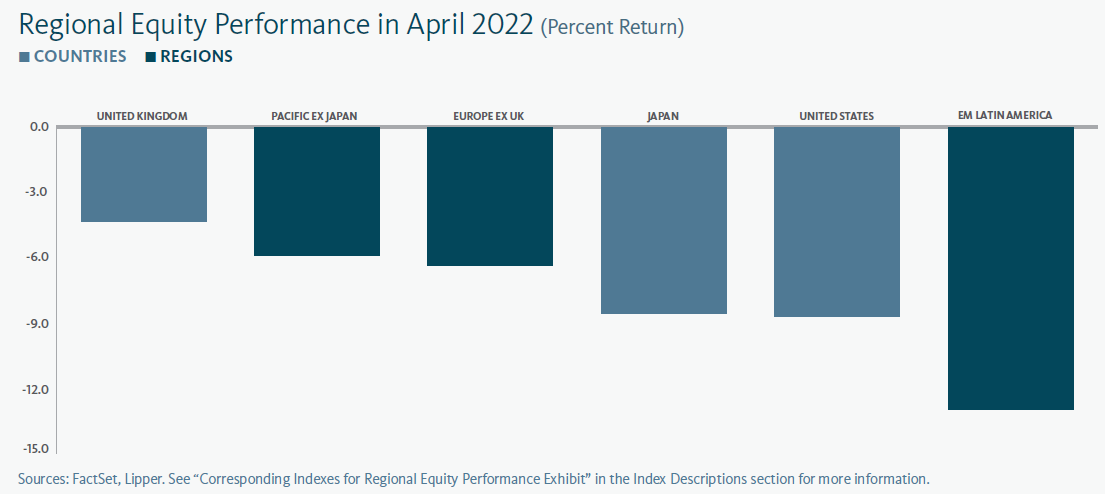
Global equities posted their largest one-month decline since March 2020 and most major equity markets delivered their poorest monthly performances of 2022.1 Developed-market shares fared worse than emerging markets.
The selloffs in UK and mainland Chinese equities were comparably shallow against the broad-based decline. Hong Kong shares fell by a bit more, followed by European equities, while Japanese and US shares suffered steeper losses. Growth-oriented equities tumbled by considerably more than value-oriented shares.
Government bond interest rates increased across all maturities in the UK, eurozone, and US during April. Generally, longer-term rates increased by more than short-term rates, resulting in steeper yield curves and partially reversing the flattening (and, in the case of US Treasurys, inversion) that had taken place in recent months.
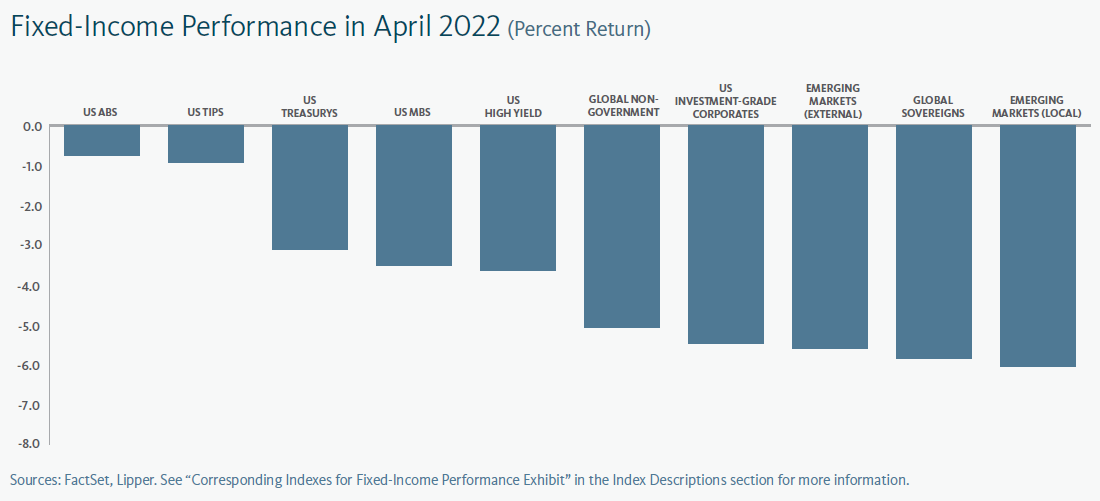
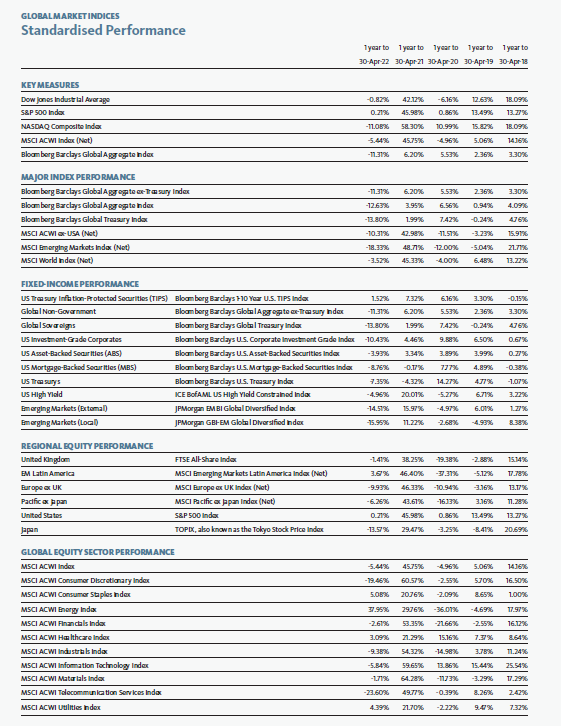
Bonds were universally negative in April as interest rates climbed (yields and prices have an inverse relationship). Inflation-indexed securities experienced relatively modest declines, while corporate bonds tumbled, and emerging-market debt delivered the deepest losses.2
The sustained commodities rally was mild compared to its first-quarter pace with the exception of natural gas. The spot price of natural gas leapt by 30.5% in April, while Brent and West-Texas Intermediate crude oil prices gained 2.32% and 4.4%, respectively. Wheat prices climbed by 4.95%.3
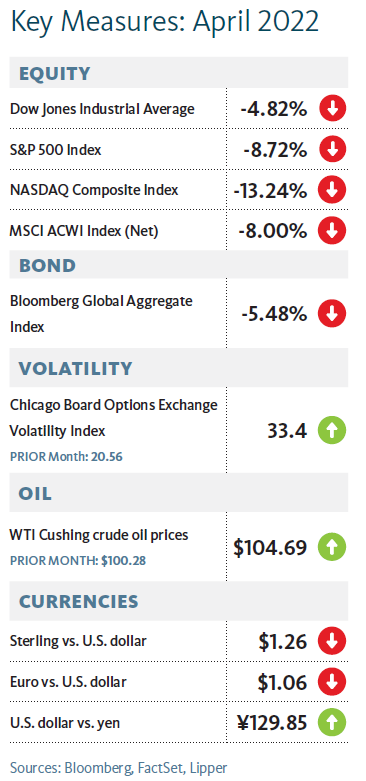
The US dollar continued to strengthen against most other currencies, climbing 4.73% during April according to the U.S. Dollar Index (DXY).
International Energy Agency (IEA) member nations announced plans in early April to release 120 million barrels of crude oil from their strategic reserves over a six-month period, representing the largest release since the IEA’s establishment in 1974.4 Half of the total will be drawn from US reserves.
The EU moved closer to banning Russian oil imports at the end of April as German representatives yielded their original opposition to the plan. The German government reported that dependence on Russian oil could end this summer,paving the way for EU-wide sanctions. An early-April ban imposed by the EU on Russian coal was expected to hit 25% of all Russian coal exports.
Gazprom, Russia’s state-controlled natural gas conglomerate, announced that supplies to Poland and Bulgaria would be turned off in late April given their refusal to pay for gas in rubles.
In mid-April, Sweden and Finland announced their intentions to join NATO on a fairly short timeline. The Scandinavian countries are working through respective internal reviews and debates with next steps expected in the middle of May.
Two high-level US delegations visited Ukraine toward the end of April as the country faced a Russian advance in the east and a worsening siege in the southeast. The first visit, by Antony Blinken (the Secretary of State) and General Lloyd Austin (the Secretary of Defense), came with a pledge of $300 million in defence financing and an approval for $165 million in ammunition sales. The second, a Congressional delegation led by Speaker of the House Nancy Pelosi, coincided with Congressional consideration of the Biden administration’s budget request for $33 billion in funding for Ukrainian defence and longer-term aid.
The US Congress passed a bill terminating the most-favoured-nation trade status that Russia and Belarus have enjoyed, paving the way for higher tariffs and duties on imports from the two countries. The ban on Russian energy imports that was enacted via executive order following Russia’s invasion of Ukraine was also formally passed into law.
Economic Data
UK
- The UK consumer prices index climbed by 6.2% in the 12 months to March, an increase from 5.5% in February.
- UK’s claimant count (which calculates the number of people claiming Jobseeker’s Allowance) continued to improve in March—declining by about 47,000, with total claimants representing 4.3% of the population in March compared to 4.4% in February.
- UK manufacturing growth remained healthy in April, just above March’s pace of expansion, but subdued relative to the more frenzied activity that defined conditions through most of 2021.5
- Services activity moderated to still-elevated levels in the UK during April after peaking at red-hot growth levels in March.6
Eurozone
- The eurozone unemployment rate fell to 6.8% in March—the lowest level since Eurostat began tracking the dataset in 1998—from an upward-revised 6.9% in February.
- Eurozone inflation increased by 0.6% in April (down from 2.4% in March) and 7.5% over the prior year (up from 7.4%).
- Eurozone manufacturing activity held in April at the moderate growth pace that prevailed in March after settling through early 2022.7
- The pace of expansion in eurozone services continued to accelerate during April, climbing to robust levels.8
- The eurozone expanded by 0.2% during the first quarter and 5.0% year over year, compared to 0.3% and 4.7%, respectively, in the fourth quarter of 2021.
US
- US job openings and resignations climbed to their highest levels in decades during March, and new weekly claims for unemployment benefits fell to a 54-year low in April.9
- The US consumer-price index increased by 8.5% in the year through March, the highest level since 1981, after rising 7.9% in the year through February.10
- Manufacturing conditions in the US continued to recover during April after growth slowed in January before beginning to rebound.11
- US services growth slowed significantly in April after accelerating sharply from the beginning of the year.12
- The overall US economy contracted by an annualised 1.4% during the first quarter, representing the first decline since the second quarter of 2020. Net exports (that is, exports minus imports) declined at an accelerating pace as imports continued to climb on high demand, private inventories decreased, and the withdrawal of fiscal spending all combined to offset continued strength in consumer and businesses outlays.
Central banks
- The Bank of England’s (BOE) Monetary Policy Committee (MPC) did not meet in April. In mid-March, it increased the bank rate to 0.75% and has begun to reduce the size of its balance sheet by ceasing to re-invest proceeds from its asset-purchase programme and through corporate bond sales.
- Following its mid-April monetary policy meeting, the European Central Bank (ECB) restated its commitment to winding down its Asset Purchase Programme—which will conclude in the third quarter following monthly net purchases of €40 billion in April, €30 billion in May and €20 billion in June.
- The US Federal Open Market Committee (FOMC) did not hold a meeting in April after voting to increase the federal funds rate by 0.25% in mid-March—its first rate hike since December 2018—and concluding new asset purchases. At its early May meeting, the central bank increased the benchmark rate by 0.50%— to a range between 0.75% and 1%—the first hike of its size since 2000. The FOMC also announced it will begin to reduce its balance sheet in June, allowing Treasurys and mortgages to run off (that is, mature without being replaced) at maximum respective paces of $60 billion and $35 billion per month.
- The Bank of Japan (BOJ) redoubled its commitment to loose monetary policy at its late-April meeting. Its short-term interest rate remained at -0.1% and the 10-year Japanese government-bond (JGB) yield target held near 0%. The central bank offered unlimited purchases of 10-year JGBs at 0.25% in order to keep its yield within the BOJ’s acceptable range.
SEI’s View
We noted in our 2022 outlook that geopolitical uncertainty was on the rise.The Russian troop build-up on the Ukrainian border topped the list of our near term concerns, and we warned that an invasion would have major economic consequences.
As was the case with the pandemic that hit with full force this time two years ago, no one knows how long the current conflict will last or how extensive its impact will be on the global economy. However, our experience with COVID-19 and the economic and financial response to prior geopolitical events serve as a guide.
Pre-invasion, we were optimistic that global economic growth would remain solid as countries eased their COVID-19-related restrictions. Europe was expected to improve at least as fast as the US, if not faster. This is now a questionable assumption. We cannot emphasise enough how uncertain the economic environment has become. Instead of seeing a normalisation of activity with fewer supply-chain delays and easing COVID-19 restrictions, we are witnessing a war that is expected to extend and exacerbate the “everything shortage.”
Although Russia’s gross domestic product amounted to just 1.8% of the world’s total in 2020 (about the same as Brazil), its importance as a commodity exporter cannot be denied. Disruption to the supply of several globally traded commodities has had a predictable result: yet another leap in commodity-price inflation.
While supply-chain pressures eased in January and February, they were still at exceptionally high levels relative to history. We think the odds favour a return to their previous peaks as freight carriers suspend Russian bookings and increase rates in response to pileups, higher energy costs, and hazardous geopolitical conditions. COVID-19-related disruptions in Asia also remain an ever-present threat.
It is fortunate for the advanced economies that households and businesses were in mostly good financial shape coming into the crisis.
Year-over-year growth in employment was continuing to accelerate heading into 2022 despite the Omicron outbreak. The US, Canada, France, and Italy have been recording gains well ahead of their longer-term trends. Job growth in Germany and the UK is still at (or slightly above) the pre-pandemic trend after having experienced smaller year-on-year declines during the 2020 pandemic lockdowns.
Despite this labour-market vibrancy, workers’ wages have begun to fall behind the high inflation rates recorded in the US and elsewhere. One would think that a contraction in real compensation is a sure sign that an economic recession is already underway. Yet that is not the case. Median wage growth in the US for the lowest-income quartile is up 5.9% over the 12 months ended February, nearly matching the rise in the Fed’s PCE Price index for overall personal-consumption expenditures. By comparison, the overall median wage gain for this period amounted to only 4.3%.
While wage gains are lagging inflation at the upper quartiles, higher-income groups have benefited from the boom in home prices and the long bull market in financial assets; they also hold the bulk of excess saving that built up during the pandemic.
Although incomes in the aggregate are not keeping up with inflation, we anticipate that households will draw down savings and increase debt in an effort to maintain living standards. In the US, the household saving rate has already fallen to 6.3% of disposable income from an average of 7.5% over the 2014-to-2019 period. Between 2005 and 2007, by contrast, the saving rate averaged less than 4%. Today, each percentage-point drop in the saving rate would translate into a 4% gain in nominal GDP.
Businesses face a similar scenario. The long period of ultra-low interest rates has allowed companies to engage in a refinancing boom. Earnings before interest and taxes in the US non-financial corporate sector cover interest expense 7.9 times, the highest ratio in more than 50 years.13
Meanwhile, Russia’s aggression toward Ukraine has placed government leaders in the US, Europe and other advanced countries in a quandary. They have been tasked with responding urgently to the crisis by providing support while simultaneously pulling back on monetary and fiscal excesses that are partially to blame for the worst inflation in decades. European governments will seek to mitigate the influx of Ukrainian refugees and the invasion-induced impact of spiking fuel and electricity costs and make a significant upward adjustment in defence spending.
By contrast, the US fiscal response to inflation is likely to be far less robust as it remains bedevilled by political gridlock. Not only has the US registered one of the largest increases in emergency spending among the major economies over the last two years, it also has one of the worst inflation problems at a time when the domestic political environment is in an extremely fractious state. Granted,
the Democrats and the Republicans in Congress have been able to work together recently to finally enact a budget agreement for the current fiscal year (almost six months late), along with a debt-ceiling increase and a $13.6 billion aid package for Ukraine. It probably will be difficult to pass additional legislation aimed at supporting the domestic economy between now and the November mid-term elections.
Turning to monetary policy, the move toward higher interest rates and the end of quantitative easing appear to be a global trend (with the main exception of Japan).
Households and businesses were in strong financial shape coming into this rate hiking cycle at a time when there is a great deal of pent-up demand. It may well take some time to put a big dent in this economic momentum. Of course, the economy will eventually tip into recession if the Fed and other central banks are forced to raise rates well above the inflation rate. That may happen during the current cycle if inflation proves harder to tamp down than currently anticipated.
There is no denying that these conditions present major challenges for financial assets beyond the uncertainties caused by war. This is especially so for long duration assets such as growth-oriented equities that trade at higher price-to earnings ratios and longer-maturity bonds.
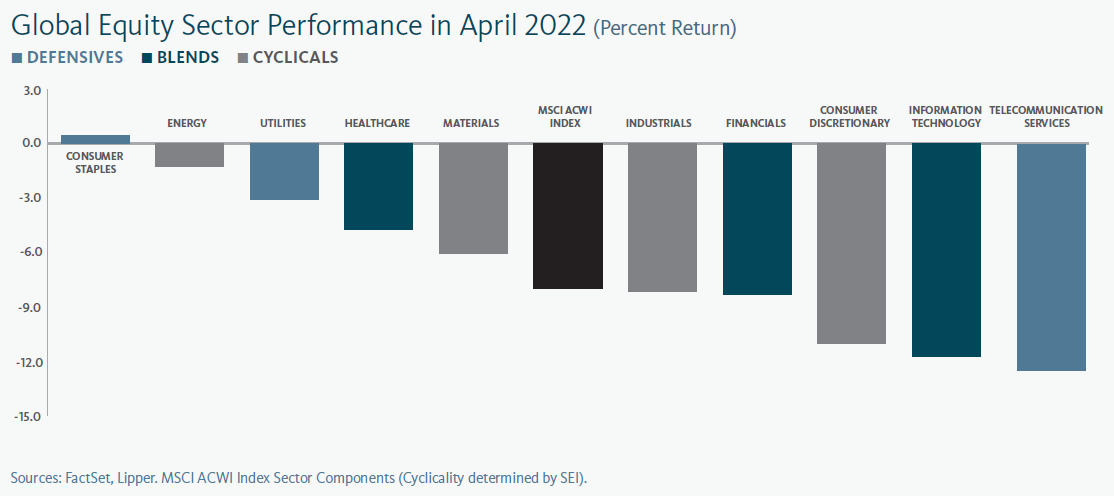
Commodity markets have been surging due to the shortages caused by COVID-19 disruptions, and now by the war in Ukraine. US value stocks have held up relatively well in the year to date, led by a large absolute price gain in the energy sector and better-than-benchmark performances in financials, utilities, industrials, materials and health care (as measured by the S&P 500 Index). Meanwhile, technology
companies and equities with high valuations have suffered as earnings multiples contracted amid the climb in bond yields, while the decline in the bond market itself is especially notable.
In emerging markets, Latin America has bucked the trend seen in other geographies as the region generally benefits from the rise in commodity prices. The jump in interest rates in countries like Brazil and Mexico has also stabilized their currencies against the US dollar despite currently high domestic rates of inflation.
Europe and Asia have been comparatively poor performers thus far in 2022. Even before the invasion, the emerging stock markets in Europe were giving ground as tensions ramped up between Russia and Ukraine.
Emerging Asia, a major consumer of commodities, also has lost ground as COVID-19 has continued to exert an impact on economic activity. The technology sector in China remains under pressure, although strong government verbal support resulted in a big rally in the middle of March.
Amid all this variability in performance, emerging markets appear to be fertile ground for active management. Volatile environments provide an opportunity for active managers to review exposures in an effort to weed out likely losers from winners.
Periods of crisis and instability are worrying for all investors, particularly as the turn of events in the short term can be difficult to predict. We saw this in the first weeks following Russia’s invasion of Ukraine, as impacts from the crisis overwhelmed more traditional market drivers.
During times like these, one of the greatest mistakes an investor can commit is to panic and indiscriminately make changes for fear of losing money. In periods of unusual stress, a clear philosophy and process can guide calm, rational, long-term decision making.
Glossary of Financial Terms
Asset Purchase Programme (APP): The ECB’s APP is part of a package of non-standard monetary policy measures that also includes targeted longer-term refinancing operations, and which was initiated in mid-2014 to support the monetary policy transmission mechanism and provide the amount of policy accommodation needed to ensure price stability.
Bull market: A bull market refers to a market environment in which prices are generally rising (or are expected to rise) and investor confidence is high.
Commercial paper: Commercial paper is a type of short-term loan that is not backed by collateral and does not tend to pay interest.
Debt ceiling: The debt ceiling refers to the US federal government’s borrowing limit, which can be changed through action by the US Congress.
European Commission: The European Commission is the executive branch of the European Union. It operates as a cabinet government, with 27 members of the Commission headed by a President.
Fiscal policy: Fiscal policy relates to decisions about government revenues and outlays, like taxation and economic stimulus.
Group of 7 (G7): The G7 is an inter-governmental forum for the leaders of major advanced democratic nations that includes Canada, France, Germany, Italy, Japan, the UK and the US.
Hawk: Hawk refers to a central-bank policy advisor who has a negative view of inflation and its economic impact, and thus tends to favour higher interest rates.
International Energy Agency (IEA): The IEA is an international organisation that advises national governments on energy policy and provides information on global energy trends.
Monetary policy: Monetary policy relates to decisions by central banks to influence the amount of money and credit in the economy by managing the level of benchmark interest rates and the purchase or sale of securities. Central banks typically make policy decisions based on their mandates to target specific levels or ranges for inflation and employment.
Mortgage-Backed Securities: Mortgage-backed securities (MBS) are pools of mortgage loans packaged together and sold to the public. They are usually structured in tranches that vary by risk and expected
return.
NATO: The North Atlantic Treaty Organization (NATO) is an intergovernmental military alliance among 28 European countries and 2 North American countries.
Pandemic Emergency Purchase Programme (PEPP): PEPP is a temporary asset-purchase programme of private and public sector securities established by the European Central Bank to counter the risks to monetary-policy transmission and the outlook for the euro area posed by the COVID-19 outbreak.
Price-to-earnings (PE) ratio: The PE ratio is equal to the market capitalization of a share or index divided by trailing (over the prior 12 months) or forward (forecasted over the next 12 months) earnings. The higher the PE ratio, the more the market is willing to pay for each dollar of annual earnings.
Quantitative easing: Quantitative easing refers to expansionary efforts by central banks to help increase the supply of money in the economy.
Summary of Economic Projections: The Fed’s Summary of Economic Projections (SEP) is based on economic projections collected from each member of the Fed Board of Governors and each Fed Bank president on a quarterly basis.
Yield: Yield is a general term for the expected return, in percentage or basis points (one basis point is 0.01%), of a fixed-income investment.
Yield curve: The yield curve represents differences in yields across a range of maturities of bonds of the same issuer or credit rating (likelihood of default). A steeper yield curve represents a greater difference between the yields. A flatter curve indicates the yields are closer together.
Index Descriptions
The Bloomberg Commodity Index is composed of futures contracts and reflects the returns on a fully collateralised investment in the Index. This combines the returns of the Index with the returns on cash collateral invested in 13-week (3-month) US Treasury bills.
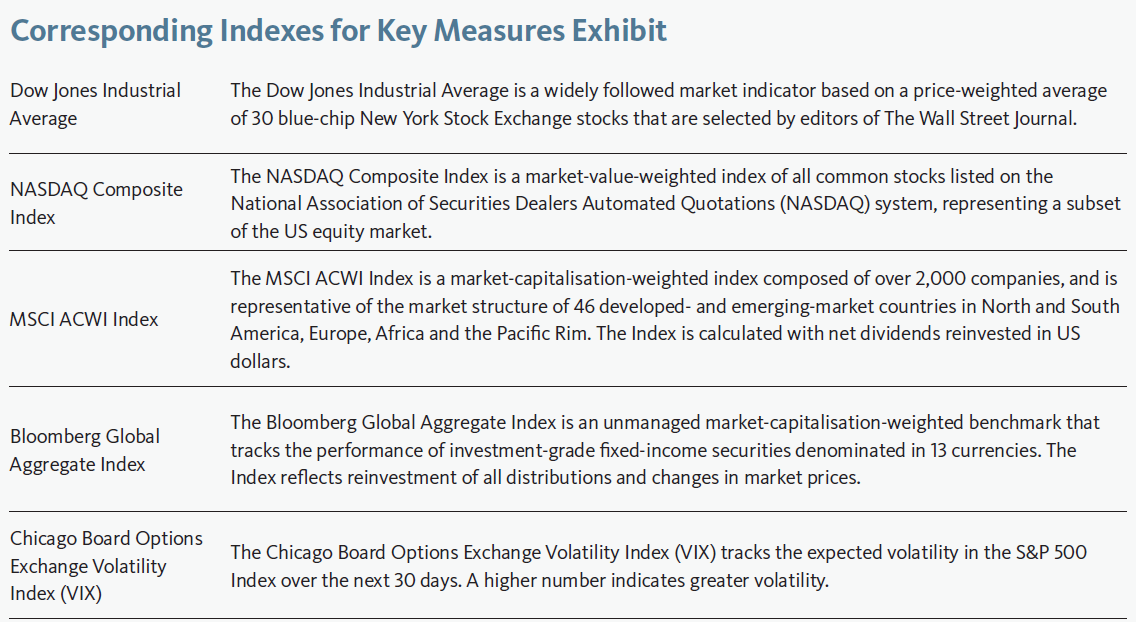
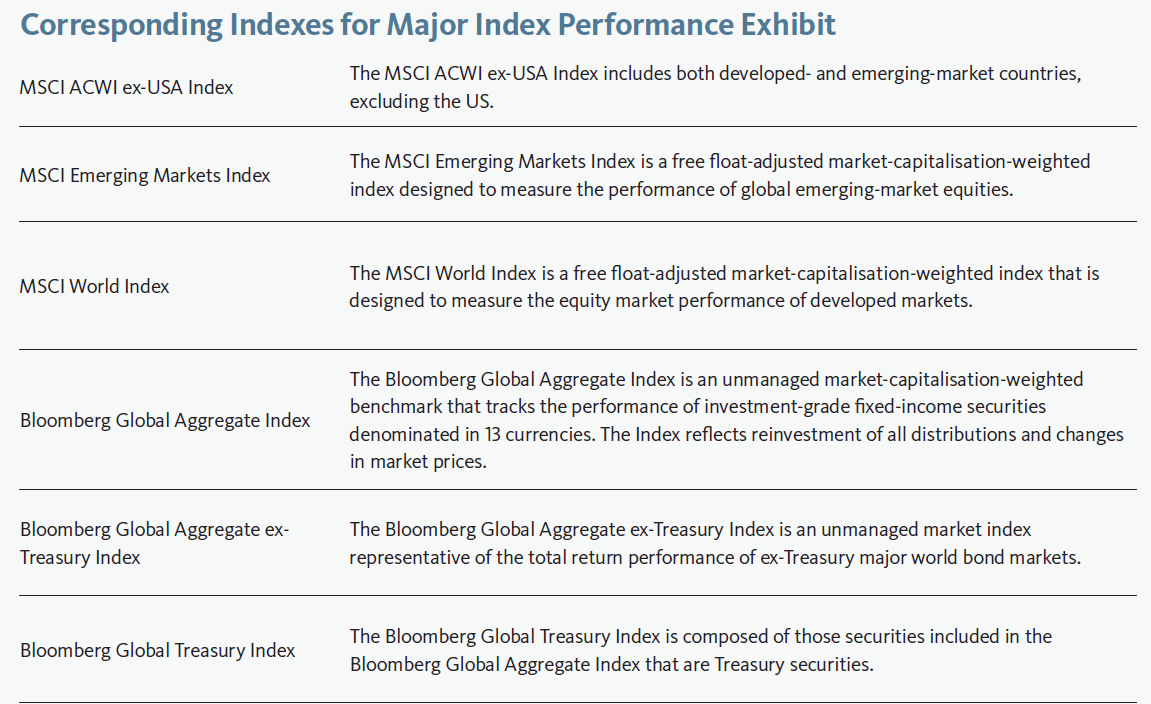
The Bloomberg Global Aggregate Index is an unmanaged market-capitalisation-weighted benchmark that tracks the performance of investment-grade fixed-income securities denominated in 13 currencies. The Index reflects reinvestment of all distributions and changes in market prices.
The US Consumer Price Index (CPI) measures changes in the price level of a weighted-average market basket of consumer goods and services purchased by households. A consumer price index is a statistical estimate constructed using the prices of a sample of representative items whose prices are collected periodically.
The MSCI ACWI Index is a market-capitalisation-weighted index composed of over 2,000 companies, and is representative of the market structure of 46 developed- and emerging-market countries in North and South America, Europe, Africa and the Pacific Rim. The Index is calculated with net dividends reinvested in US dollars.
The US Personal Consumption Expenditures (PCE) Price Index is the primary inflation index used by the Federal Reserve when making monetary-policy decisions.
The S&P 500 Index is a market-capitalization-weighted index that consists of 500 publicly-traded large U.S. companies that are considered representative of the broad U.S. stock market.
The U.S. Dollar Index (DXY Index) measures the value of the U.S. dollar relative to a basket of other currencies, including the currencies of some of the US’s major trading partners: the euro, Swiss franc, Japanese yen, Canadian dollar, British pound, and Swedish krona.
Important Information
Data refers to past performance. Past performance is not a reliable indicator of future results.
Investments in SEI Funds are generally medium- to long-term investments. The value of an investment and any income from it can go down as well as up. Investors may get back less than the original amount invested. Returns may increase or decrease as a result of currency fluctuations. Additionally, this investment may not be suitable for everyone. If you should have any doubt whether it is suitable for you, you
should obtain expert advice.
No offer of any security is made hereby. Recipients of this information who intend to apply for shares in any SEI Fund are reminded that any such application may be made solely on the basis of the information contained in the Prospectus. This material represents an assessment of the market environment at a specific point in time and is not intended to be a forecast of future events, or a guarantee of future results. This information should not be relied upon by the reader as research or investment advice regarding the funds or any stock in particular, nor should it be construed as a recommendation to purchase or sell a security, including futures contracts.
In addition to the normal risks associated with equity investing, international investments may involve risk of capital loss from unfavourable fluctuation in currency values, from differences in generally accepted accounting principles or from economic or political instability in other nations. Bonds and bond funds are subject to interest rate risk and will decline in value as interest rates rise. High yield bonds involve greater risks of default or downgrade and are more volatile than investment grade securities, due to the speculative nature of their investments. Narrowly focused investments and smaller companies typically exhibit higher volatility. SEI Funds may use derivative instruments such as futures, forwards, options, swaps, contracts for differences, credit derivatives, caps, floors and currency forward contracts. These instruments may be used for hedging purposes and/or investment purposes.
While considerable care has been taken to ensure the information contained within this document is accurate and up-to-date, no warranty is given as to the accuracy or completeness of any information and no liability is accepted for any errors or omissions in such information or any action taken on the basis of this information.
This information is issued by SEI Investments (Europe) Limited, 1st Floor, Alphabeta, 14-18 Finsbury Square, London EC2A 1BR which is authorised and regulated by the Financial Conduct Authority.
SEI sources data directly from FactSet, Lipper, and BlackRock, unless otherwise stated.
The opinions and views in this commentary are of SEI only and should not be construed as investment advice.
Please refer to our latest Prospectus (which includes information in relation to the use of derivatives and the risks associated with the use of derivative instruments), Key Investor Information Document, Summary of UCITS Shareholder rights (which includes a summary of the rights that shareholders of our funds have) and the latest Annual or Semi-Annual Reports for more information on our funds, which can be located at Fund Documents. And you should read the terms and conditions contained in the Prospectus (including the risk factors) before making any investment decision.


