Monthly market commentary: AI stocks have company in a broader market upturn.
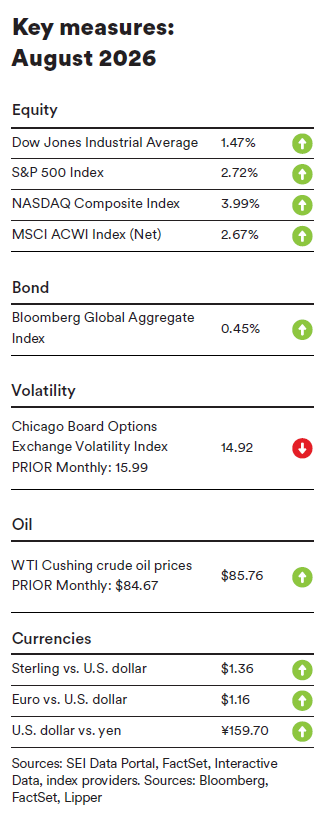
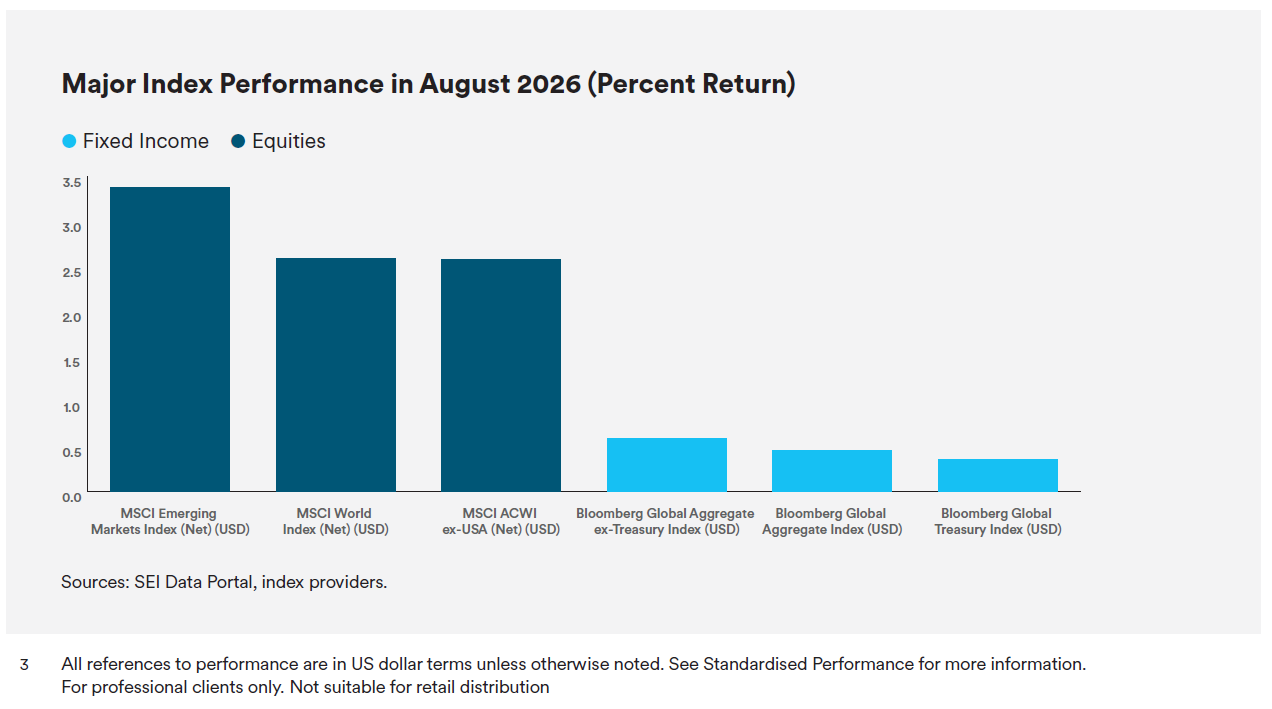
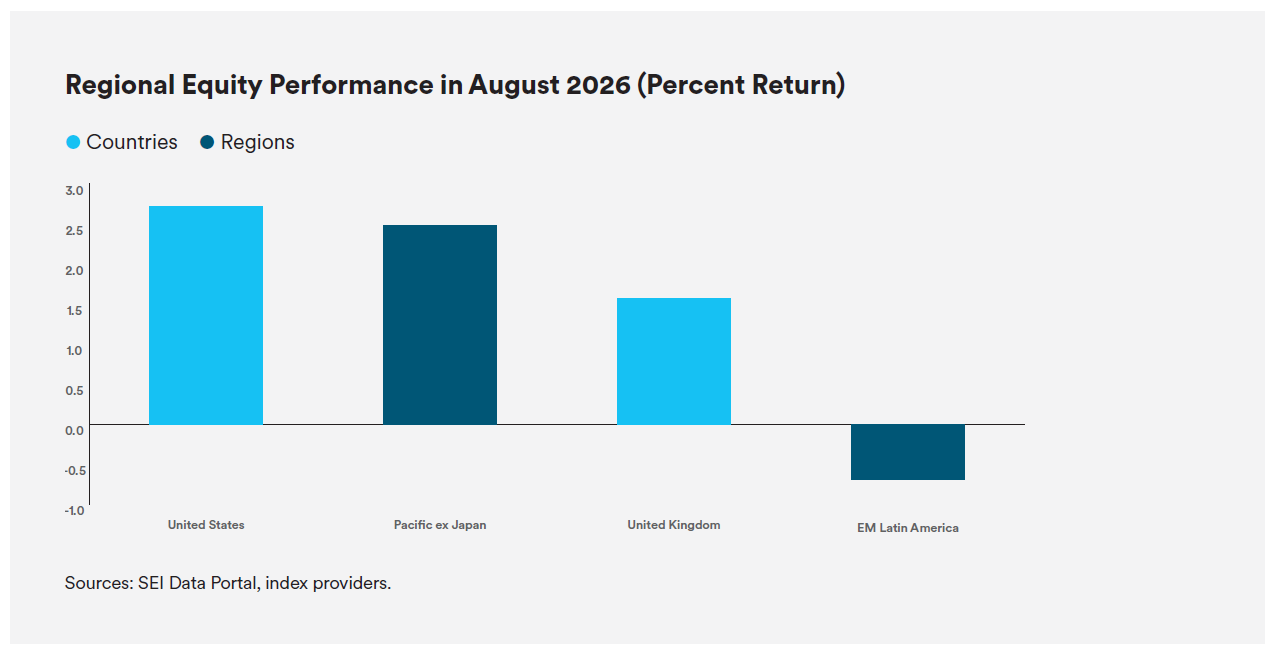
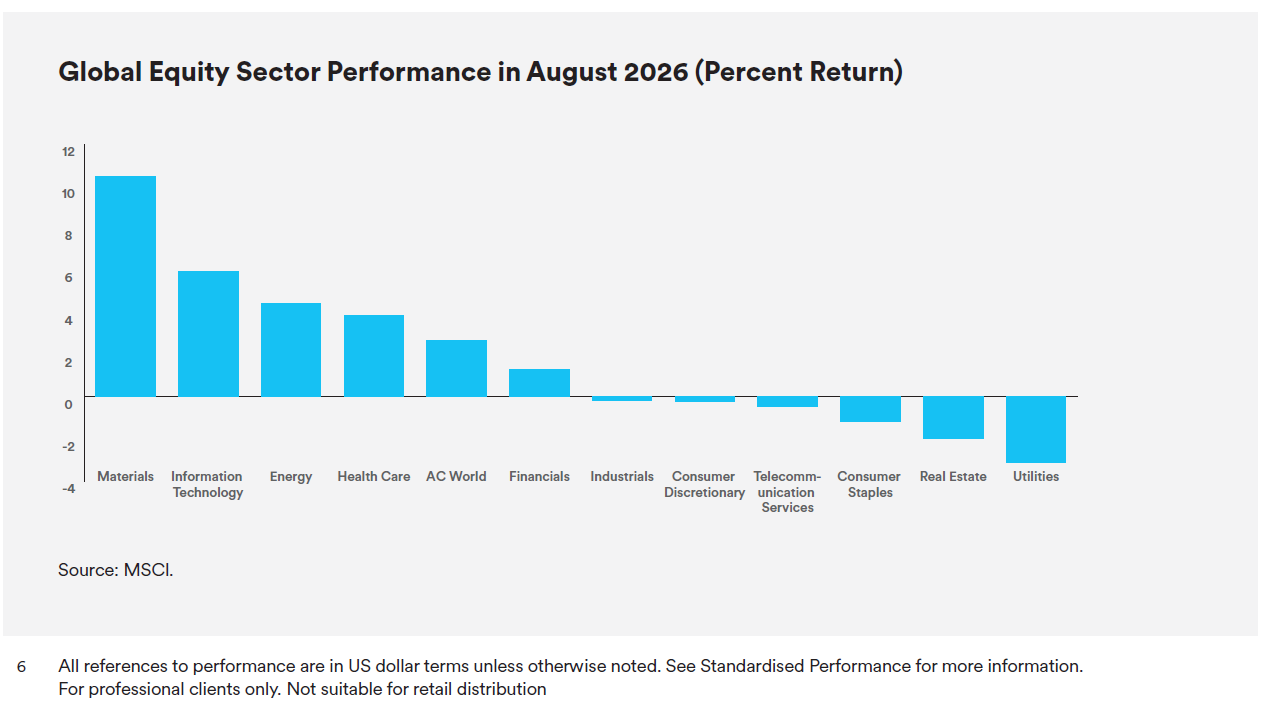
Global equity markets, as measured by the MSCI ACWI Index, garnered positive returns in August. Investors’ optimism regarding relatively strong corporate earnings, which triggered a broader market rally beyond artificial intelligence (AI)-related technology stocks, offset concerns that sticky inflation might lead central banks to keep monetary policy restrictive for longer, as well as escalating geopolitical tensions in the Middle East. Emerging markets modestly outperformed developed markets in August. Europe and Eastern Europe were the strongest-performing emerging markets for the month due mainly to an upturn in Poland. Europe also benefited from a rally in Greece. In contrast, the Association of Southeast Asian Nations (ASEAN) region was hampered by market declines in the Philippines and Thailand, while Latin America posted a negative return amid weakness in Colombia and Brazil. The Far East led developed markets in August due primarily to strength in Singapore. The Nordic countries were bolstered by market upturns in Norway and Finland. Conversely, Europe’s underperformance for the month was attributable to market downturns in France and Switzerland.
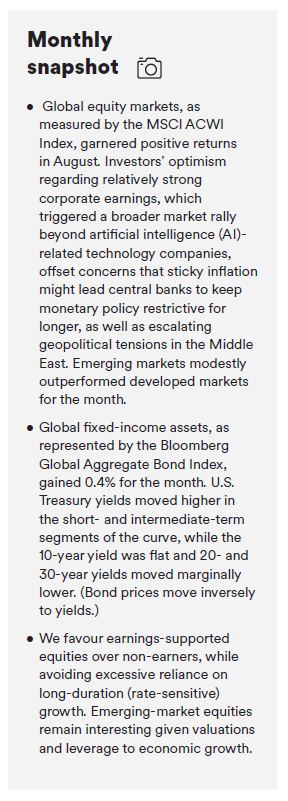
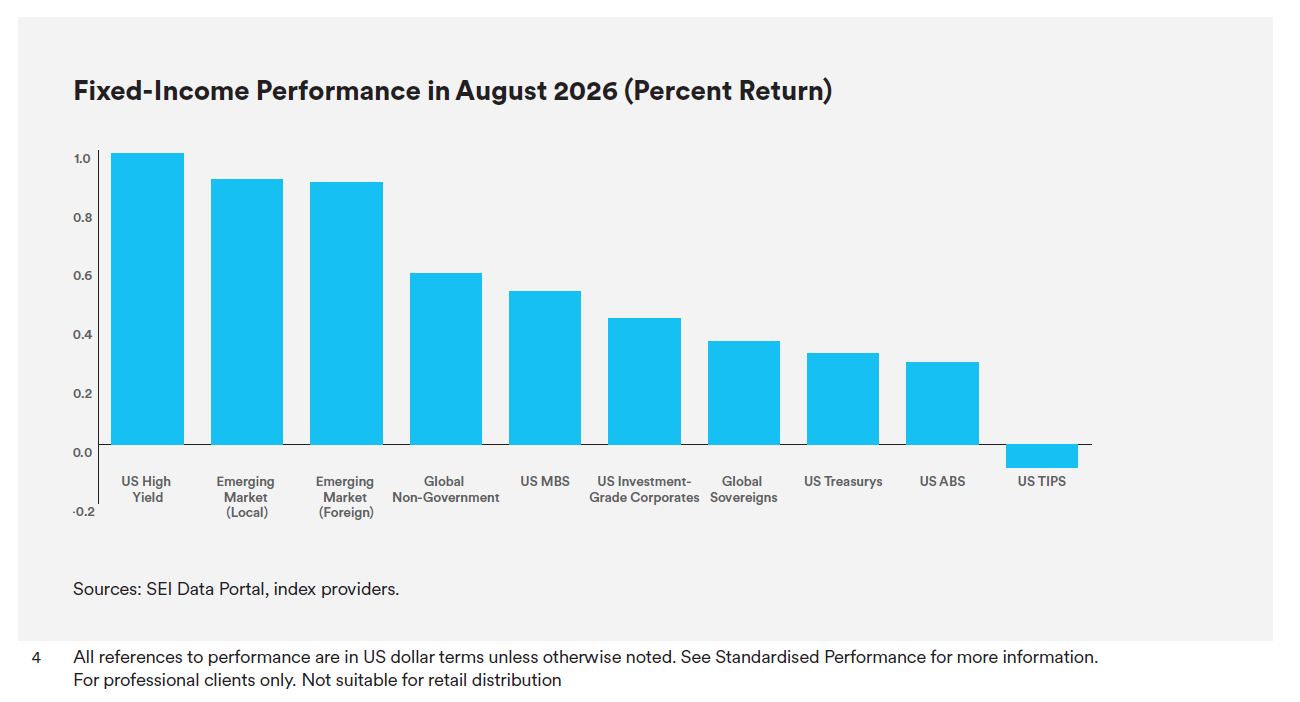
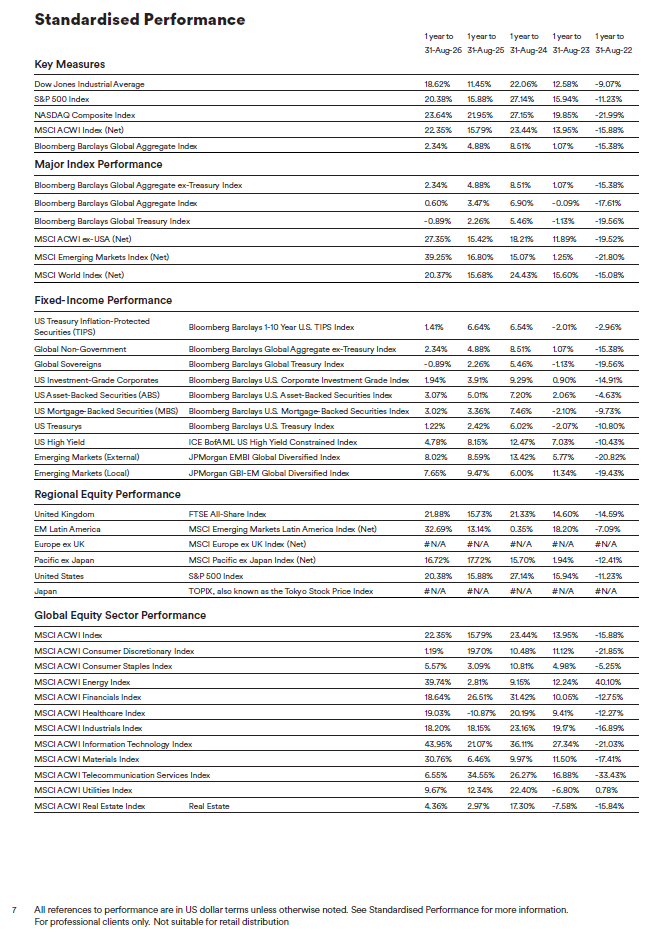
Global fixed-income assets, as represented by the Bloomberg Global Aggregate Bond Index, gained 0.4% in August. High-yield bonds led the U.S. fixed-income market, followed by mortgage-backed securities (MBS), investment-grade corporate bonds, and U.S. Treasury securities. U.S. Treasury yields moved higher in the short- and intermediate-term segments of the curve, while 20- and 30-year yields moved marginally lower. (Bond prices move inversely to yields.) Yields on 2-, 3-, and 5-year Treasury notes rose 0.06%, 0.06%, and 0.04%, ending August at 4.34%, 4.40%, and 4.49%, respectively, while the 10-year yield was unchanged at 4.75%. The 10-year to 3-month yield curve narrowed by 8 basis points (0.08%) to +0.84% as of the end of the month.
The yield on the 30-year U.S. Treasury bond reached a 19-year high of 5.34% in intraday trading on 18 August, fueled by concerns about inflation and tighter Federal Reserve (Fed) monetary policy, as well as a surge in debt issuance from artificial intelligence (AI)-related companies, which has resulted in increased competition with the U.S. government to attract investors. However, the 30-year yield moved modestly lower after the Department of the Treasury announced a plan to increase buybacks of long-dated securities, which boosted demand for 10-to-30-year bonds. The 30-year yield ended the month down 2 basis points (0.02%) to 5.25%.
Global commodity prices, as represented by the Bloomberg Commodity Index, gained 7.4% in August. Oil prices moved higher as investors priced in the risk of supply disruptions and reduced tanker traffic through the Strait of Hormuz. Additionally, late in the month, the intensified U.S. attacks on Iran raised fears that the conflict could broaden and threaten regional energy infrastructure. The West Texas Intermediate (WTI) and Brent crude oil prices rose 1.3% and 2.9%, respectively, during the month. The gold price climbed 9.1% in August due to a weakening U.S. dollar (the gold price tends to move inversely to the dollar), uncertainty surrounding the conflict in the Middle East, and growing concerns about rising U.S. government debt. The New York Mercantile Exchange (NYMEX) natural gas price was up 6.8% for the month as persistent summer heat boosted cooling-related demand, and investors expected smaller-than-normal additions to storage inventories, reducing concerns about oversupply and improving the supply-demand outlook. The 21.1% surge in the wheat price during the month was in response to attacks on Black Sea shipping routes, ports, and grain-export infrastructure, which fanned concerns about disruptions to global supplies from Russia and Ukraine, two of the world’s largest wheat exporters.
The Middle East war took several wide turns in August. Early in the month, the focus of U.S.-Iran diplomacy was on a potential agreement to reopen the Strait of Hormuz. Reports indicated that Iran and Oman were finalizing a draft arrangement that would establish designated shipping lanes through the waterway and could pave the way for broader negotiations involving sanctions relief and Iran’s nuclear program. However, U.S. officials have continued to oppose any arrangement that would grant Tehran control over maritime traffic, while Gulf nations have expressed concerns that even a temporary agreement could increase Iran’s leverage over a global energy corridor.
Efforts to pressure Iran subsequently shifted toward an economic campaign as the administration of U.S. President Donald Trump launched Operation Economic Outcast, a sanctions initiative targeting entities and networks that facilitate Iranian oil sales, technology procurement, cyber activity, and financial transactions. The initiative followed the expiration of the 60-day negotiating window established under the June memorandum of understanding (MOU) and expanded the economic component of the administration’s broader pressure campaign. However, the measures stopped short of directly targeting major Chinese financial institutions, underscoring the challenges involved in severing Iran’s largest remaining economic lifeline. Meanwhile, Iran continued negotiations with Oman over maritime access through the Strait, while Qatar renewed efforts to facilitate broader de-escalation talks.
On 30 August, the U.S. military conducted strikes on two Iranian rocket launchers on Larak Island in the Strait―the first direct U.S. attack on Iranian assets in several weeks and raising concerns about renewed escalation of the conflict in the Middle East. According to U.S. Central Command, the launchers were preparing to fire rockets loaded with sea mines into the Strait weeks after U.S. forces had cleared mines from international shipping routes. The situation intensified shortly afterward when Iran launched missiles toward Jordan; the Jordanian government reported that that its military intercepted eight missiles that entered the nation’s airspace.
U.S. trade policy returned to the geopolitical spotlight late in the month. After U.S.-Canada trade negotiations broke down on 21 August, the Trump administration imposed 50% tariffs on roughly $20 billion in Canadian imports, including wine, cement and hockey sticks, with the new duties taking effect the following day. The tariffs represent a significant escalation in the trade conflict between the two countries. Trump also announced that levies on Canadian cars, trucks, auto parts, and steel will double to 50% beginning 1 January 2027, unless production is moved to the U.S. Canadian Prime Minister Mark Carney responded by pledging “dollar-for-dollar” retaliatory tariffs on U.S. goods, setting the stage for a broader North American trade war that could increase costs for manufacturers and consumers on both sides of the border.
Economic data
U.S.
The Department of Labor reported that the consumer-price index (CPI) ticked up 0.1% in July, an increase from the 0.4% decline in June but slightly below expectations. Costs for utility gas service rose 0.7% in July, while gasoline and fuel oil prices were down by corresponding margins of 2.9% and 1.7%. The CPI advanced at a lower-than-expected rate of 3.4% year-over-year, edging down from the 3.5% annual increase in June. Fuel oil and gasoline prices surged 39.1% and 24.6%, respectively, over the previous 12-month period. Core inflation, as measured by the CPI for all items less food and energy, was up 2.5% year-over-year in July, down marginally from the 2.6% increase in June. Apparel and shelter costs rose 3.9% and 3.2%, respectively, over the previous 12-month period. Conversely, prices for used cars and trucks declined 1.9% year-over-year.
According to the second estimate from the Department of Commerce, U.S. gross domestic product (GDP) grew at an annual rate of 1.5% for the second quarter of 2026, down from the 2.1% growth rate in the first quarter of the year. The upturn in GDP for the second quarter was attributable to increases in consumer spending, exports, and investment. There was a decline in government spending and an increase in imports, which are a subtraction in the calculation of GDP. The relatively lower economic growth rate compared to the first quarter was attributable to downturns in government spending, investment, and exports, which offset a rise in consumer spending.
U.K.
The Office for National Statistics (ONS) reported that inflation in the U.K., as measured by the CPI, rose 0.3% in July, up from the 0.1% increase in June. Costs for housing and household services, and healthcare increased 2.3% and 0.5%, respectively for the month, while prices for clothing and footwear, and furniture and household goods fell by corresponding margins of 0.9% and 0.4%. The CPI advanced at an annual rate of 2.9% in July, higher than the 2.6% advance in June. Education, communication, and Furniture and household goods posted the largest price gains for the month, rising by corresponding margins of 5.1%, 5.0%, and 4.6%, respectively.
The ONS also announced that U.K. GDP edged up 0.3% in June (the most recent reporting period), an improvement from the flat reading in May. Output in the services sector rose 0.4% in June, while the construction and production sectors dipped 0.1% and 0.2%, respectively. GDP grew 0.4% for the three-month period ending June 30, 2026, down slightly from the 0.6% growth rate for the previous three-month period (January 1 to March 31, 2026). Output in the services and construction sectors rose 0.5% and 0.3% for the period, while production output was flat.
Eurozone
Eurostat pegged inflation for the eurozone at 2.9% for the 12-month period ending in July, marginally higher than the 2.8% annual increase in June. Energy prices surged 10.3% year-over-year in July due to the ongoing blockade in the Strait of Hormuz, affecting a significant amount of global oil capacity, and costs for services rose 3.3% compared to the same period in 2025.
According to Eurostat, eurozone GDP grew 0.4% in the second quarter of 2026, improving from the flat reading for the first quarter of the year and unchanged from the flash estimate (a preliminary measure of economic growth) released in late July. The upturn in GDP for the second quarter was attributable largely to the economies of Ireland, Lithuania, and Sweden, which expanded by corresponding margins of 3.9%, 1.7%, and 1.4%. Belgium and Austria saw flat GDP growth over the quarter.
SEI’s view
We remain constructive overall on the global economy and risk assets, but we are more selective. The market cycle is becoming more inflation-sensitive, more rate-volatilitysensitive, and more dependent on physical bottlenecks than on pure financial liquidity. The correct framing is not recession versus expansion; it is whether growth remains strong enough to support earnings without forcing real yields, term premia, and the U.S. dollar high enough to compress valuations. U.S. economic growth remains resilient, but that is a double-edged sword. Manufacturing activity, labor-market momentum, macro surprise indicators, and earnings revisions do not point to an imminent recession.
In remarks at the Fed’s annual Jackson Hole Economic Symposium in Wyoming on August 28, Fed Chair Kevin Warsh provided little explicit guidance about the future path of interest rates, reiterating his preference for a restrained approach to Fed communications. Warsh emphasized that monetary policy decisions should be based on current economic conditions and broader economic trends rather than isolated data points or mechanical forecasts. While describing economic growth and labor-market conditions as resilient, Warsh argued that inflation remains too high and said that the central bank must be confident that underlying inflation is moving toward its 2% objective at a sufficient pace. SEI and avid Fed watchers alike will be closely parsing public comments from central bank officials for clues as to whether this groundswell of support for tighter policy continues to build. While short-term market-implied inflation expectations haven’t budged, the fundamental drivers of inflation―including economic strength, ongoing geopolitical tensions, and continued onshoring and near-shoring of supply chains―remain intact.
Elsewhere, both the European Central Bank and the Bank of England have adopted a cautiously hawkish tone as higher energy prices threaten to place upward pressure on inflation, particularly in economies that remain vulnerable to oil-price shocks. Unlike the U.S., where inflation has been supported by relatively resilient economic growth and domestic demand, inflation risks in Europe and the U.K. are more closely tied to supply side factors, particularly energy costs and their potential spillover effects across the broader economy.
Corporate earnings are still a source of support for global equity markets. Forward earnings growth and revisions remain positive, and earnings breadth is healthier than return concentration suggests, particularly in the U.S. and Japan, as well as across the global manufacturing and AI supply-chain cycle. Valuation discipline matters more now. The U.S. and parts of Asia look expensive, while Europe, the U.K., and selected value-oriented segments appear more reasonably priced. Markets can continue to work, but the margin of safety is thinner. Investment opportunities are broadening beyond mega-cap growth stocks. AI remains an important theme; however, the next phase increasingly depends on chips, power, grids, cooling, data centers, energy, materials, and industrial capacity. The beneficiaries may shift from software narratives toward infrastructure and old economy enablers. Active management remains a key call this year with positive exposures to global value, quality, and momentum factors, with value as the primary emphasis. We favour earnings-supported equities over non-earners, while avoiding excessive reliance on long-duration (rate-sensitive) growth.
Within the fixed-income universe, bonds are less reliable as a hedge. Elevated stock-bond correlations, higher inflation volatility, and rising term premia mean that Treasurys are likely to trade more like risk assets than they have in recent cycles. We believe inflation-linked exposure is more attractive than nominal bonds as breakeven rates are still underpricing persistent inflation pressure.
1 All equity market performance statements are based on the MSCI ACWI Index.
2 According to the U.S. Department of the Treasury. As of 31 August 2026.
3 According to the ONS. 19 August 2026.
4 According to the ONS. 13 August 2026.
5 According to Eurostat. 19 August 2026.
6 According to Eurostat. 14 August 2026.
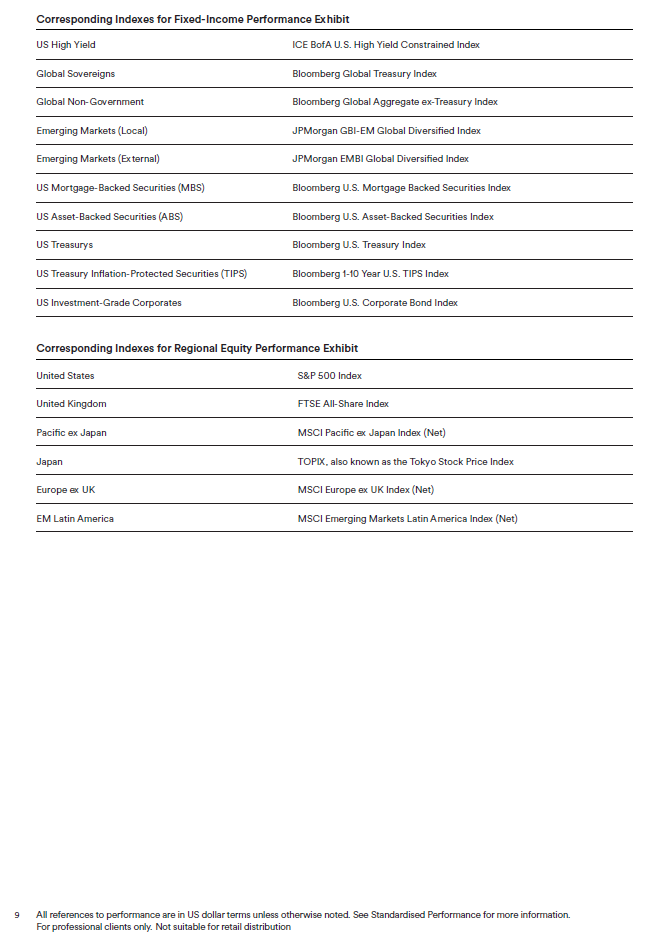
GLOSSARY AND INDEX DEFINITIONS
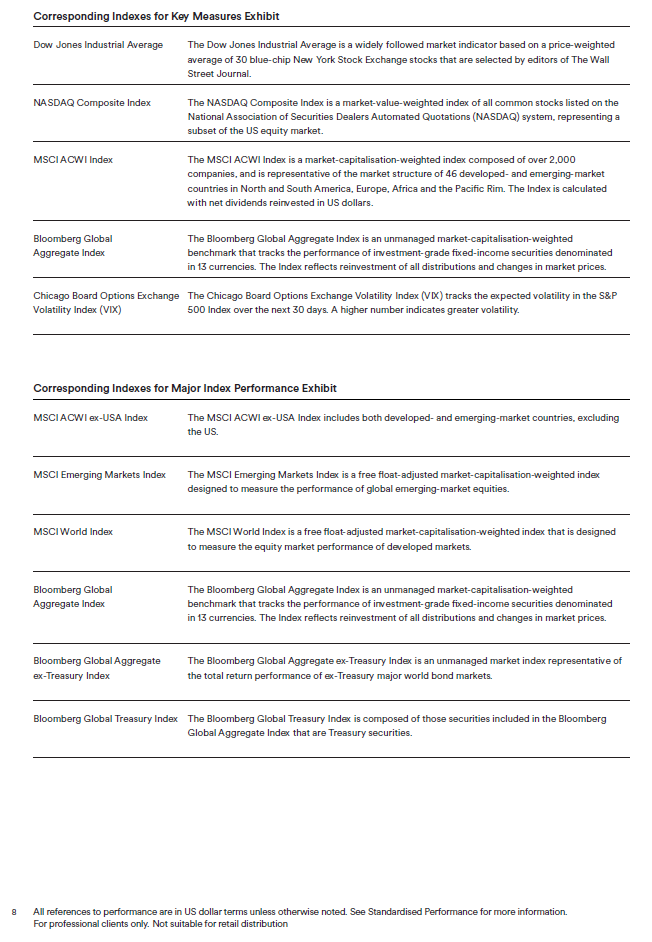
For financial term and index definitions, please see: seic.com/ent/imu-communications-financial-glossary
IMPORTANT INFORMATION
This material represents an assessment of the market environment at a specific point in time and is not intended to be a forecast of future events or a guarantee of future results. Positioning and holdings are subject to change. All information as of the date indicated.
This information should not be relied upon by the reader as research or investment advice, (unless you have otherwise separately entered into a written agreement with SEI for the provision of investment advice) nor should it be construed as a recommendation to purchase or sell a security. The reader should consult with their financial professional for more information. Statements that are not factual in nature, including opinions, projections and estimates, assume certain economic conditions and industry developments and constitute only current opinions that are subject to change without notice. Nothing herein is intended to be a forecast of future events, or a guarantee of future results.
Certain economic and market information contained herein has been obtained from published sources prepared by other parties, which in certain cases have not been updated through the date hereof. While such sources are believed to be reliable, neither SEI nor its affiliates assumes any responsibility for the accuracy or completeness of such information and such information has not been independently verified by SEI.
There are risks involved with investing, including loss of principal. The value of an investment and any income from it can go down as well as up. Investors may get back less than the original amount invested. Returns may increase or decrease as a result of currency fluctuations. Past performance is not a reliable indicator of future results. Investment may not be suitable for everyone.
This material is not directed to any persons where (by reason of that person's nationality, residence or otherwise) the publication or availability of this material is prohibited. Persons in respect of whom such prohibitions apply must not rely on this information in any respect whatsoever.
The information contained herein is for general and educational information purposes only and is not intended to constitute legal, tax, accounting, securities, research or investment advice regarding the strategies or any security in particular, nor an opinion regarding the appropriateness of any investment. This information should not be construed as a recommendation to purchase or sell a security, derivative or futures contract. You should not act or rely on the information contained herein without obtaining specific legal, tax, accounting and investment advice from an investment professional. While considerable care has been taken to ensure the information contained within this document is accurate and up-to-date, no warranty is given as to the accuracy or completeness of any information and no liability is accepted for any errors or omissions in such information or any action taken on the basis of this information.
Index returns are for illustrative purposes only, and do not represent actual account performance. Index returns do not reflect any management fees, transaction costs or expenses. Indexes are unmanaged and one cannot invest directly in an index. Not all strategies discussed may be available for your investment.
Information issued in the UK by SEI Investments (Europe) Ltd, 1st Floor, Alphabeta, 14-18 Finsbury Square, London EC2A 1BR which is authorised and regulated by the Financial Conduct Authority.
The contents of this document have not been reviewed by any regulatory authority in Hong Kong. You are advised to exercise caution in relation to the offer. If you are in any doubt about any of the contents of this document, you should obtain independent professional advice.
This information is made available in Latin America and the Middle East FOR PROFESSIONAL (non-retail) USE ONLY by SIEL.
Any questions you may have in relation to its contents should solely be directed to your Distributor. If you do not know who your Distributor is, then you cannot rely on any part of this document in any respect whatsoever.
Issued in South Africa by SEI Investments (Europe) Ltd, an authorised financial services provider (FSP No. 9796). This material is general information only and does not constitute financial advice, as defined in the Financial Advisory and Intermediary Services Act, 2002. It has been prepared without taking account of any person’s investment objectives, financial situation or particular needs. Recipients should obtain appropriate independent financial, tax and legal advice before making an investment decision.
SIEL is not licensed under Israel’s Regulation of Investment Advising, Investment Marketing and Portfolio Management Law, 5755-1995 (the “Advice Law”) and does not carry insurance pursuant to the Advice Law. This document and any of the SEI Funds mentioned herein have not been approved by the Israeli Securities Authority (the “ISA”).
This material is intended for information purposes only and the information in it does not constitute financial advice as contemplated in terms of the Financial Advisory and Intermediary Services Act.
For professional clients only. Not suitable for retail distribution.