Long - end U.S. Treasury yields: What’s going on ?
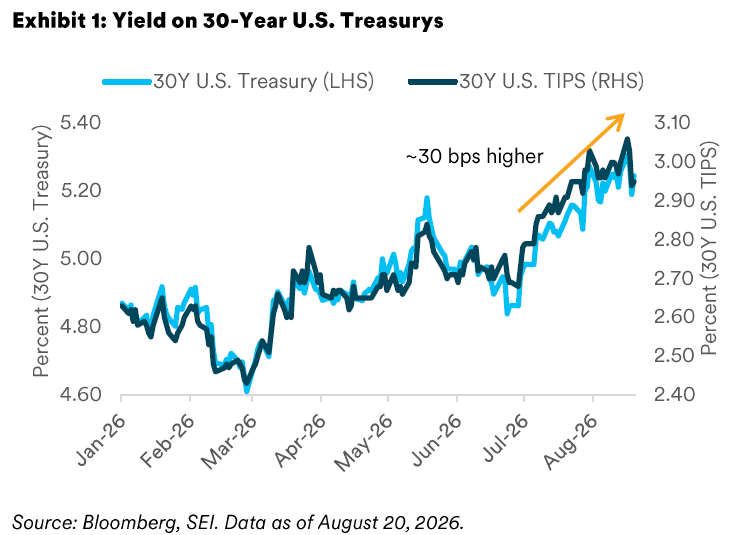
The long end of the U.S. Treasury curve has re-emerged as one of the market's key pressure points. Since the start of the quarter, the 30-year Treasury yield has climbed roughly 30 basis points (bps, 1 bps = 0.01%) to move decisively above 5%; yields now sit more than 60 basis points above their late-February lows. The rise reflects a combination of persistent inflation, resilient growth, limited policy guidance from a new Federal Reserve (Fed) Chair, elevated fiscal deficits, and an expanding supply of both government and corporate debt. Together, these forces are prompting investors to demand a higher term premium in the U.S. and globally.
Why are yields moving higher?
A move in Real Yields, Persistent inflation and the Fed’s Next Move
The move higher in 30-year nominal Treasury yields has been driven by increases in both real yields and inflation expectations. Rising real yields reflect a market reassessment of the long-term economic outlook, with investors pricing stronger growth, a potentially higher neutral interest rate, and a less accommodative path for future Fed policy. At the same time, with inflation remaining above the Federal Reserve's 2% target for five consecutive years, investors have become increasingly skeptical of the central bank's willingness to bring price pressures fully under control. Newly appointed Fed Chair Kevin Warsh initially helped ease concerns during his inaugural press conference in June, where Mr. Warsh emphasized that the Fed's commitment to restoring price stability was "strong, unanimous, and unambiguous." Markets interpreted these remarks as a signal that controlling inflation would remain the Fed's overriding priority.
Confidence, however, faded quickly. At his second press conference in July, the market's focus shifted from what Chairman Warsh said, to what he left unsaid. While he reaffirmed the Fed's commitment to price stability, he stopped short of outlining the circumstances under which policymakers would further tighten policy. The lack of guidance came at a challenging time, with economic data generally surprising to the upside and inflation persisting above target. Against a backdrop of political pressure for lower interest rates, investors have begun to question whether the Fed’s actions will ultimately match the Chairman’s rhetoric; this despite three regional presidents dissenting in favor of an immediate hike.
Debts, deficits, and footing the bill
The U.S. federal government continues to run a budget deficit of approximately 6% of gross domestic product (GDP), contributing to a record level of federal debt that has recently surpassed $40 trillion.
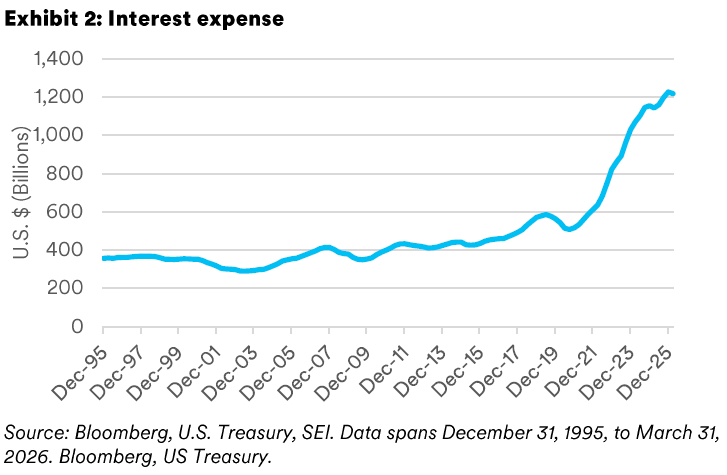
This amounts to a debt-to-GDP ratio of approximately 125%; a level that is historically high by both U.S. and global standards. Combined with elevated interest rates, the cost of servicing this debt has risen to roughly $1.2 trillion annually. Interest expense is now the second-largest expenditure of the U.S. federal government, trailing only Social Security and exceeding spending on Medicare. This highlights the growing fiscal burden associated with persistent deficits and rising debt levels.
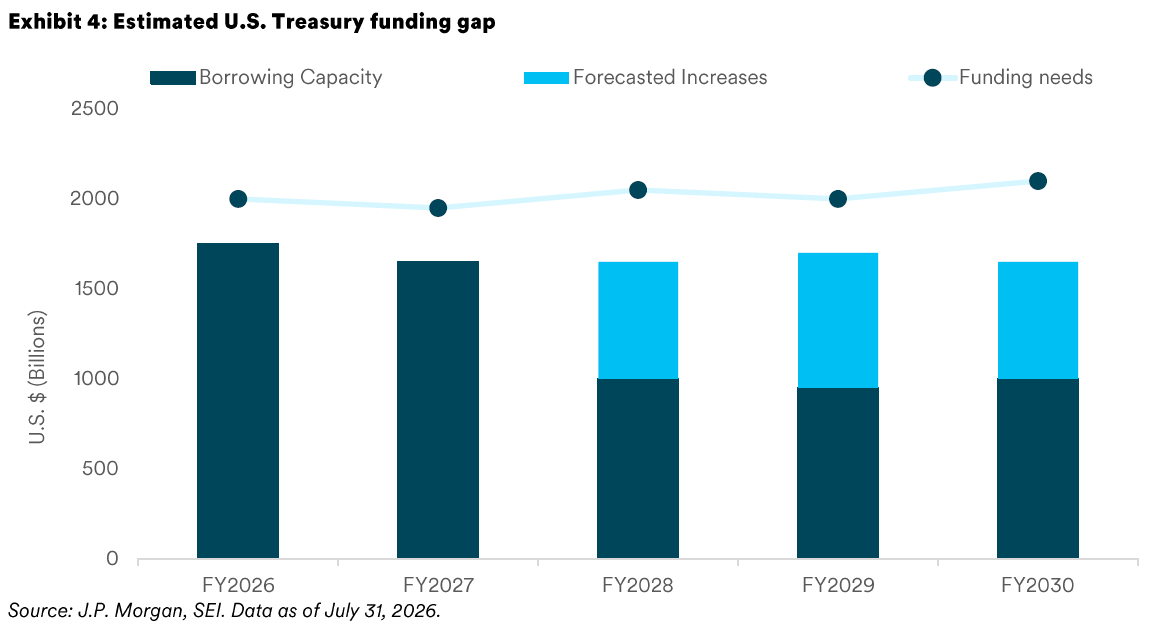
Markets are becoming increasingly concerned about the U.S. government's future funding requirements and the implications for U.S. Treasury issuance. This is despite the Treasury generally protecting the backend of the curve by keeping coupon issuance relatively stable in recent times. As a result, investors are increasingly focused on the market's capacity to absorb additional Treasury supply. According to estimates from J.P. Morgan, the U.S. Treasury is already facing a funding gap, reinforcing concerns that borrowing needs and debt issuance may remain elevated well into the future.
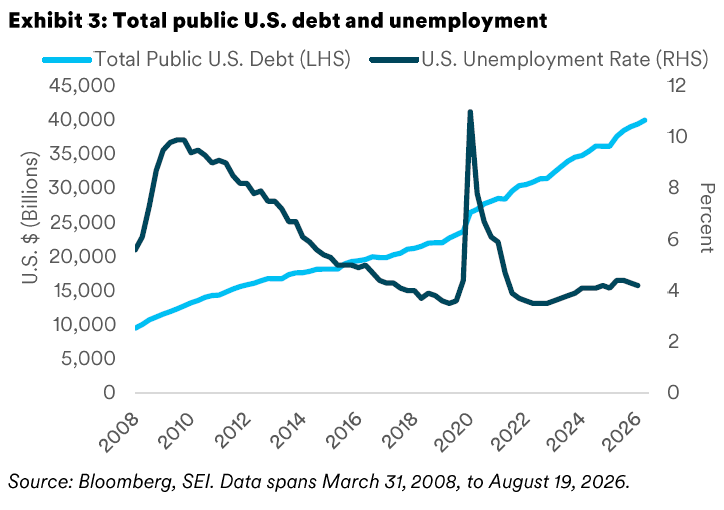
While the U.S. debt burden has continued to rise, the U.S. economy has benefitted from expanded fiscal spending in the form of elevated nominal growth and below average unemployment.
AI hyperscalers in hyperdrive
While not a primary driver of the recent increase in long-term Treasury yields, the surge in debt issuance by large technology companies—particularly AI hyperscalers such as Alphabet, Amazon, Meta, Microsoft, and Oracle—may be contributing to upward pressure on yields at the margin. More so than traditional corporate issuers, hyperscalers have shown a strong preference for issuing debt at longer maturities, with 30-year bonds accounting for more than 30% of total long-end investment-grade issuance year-to-date.
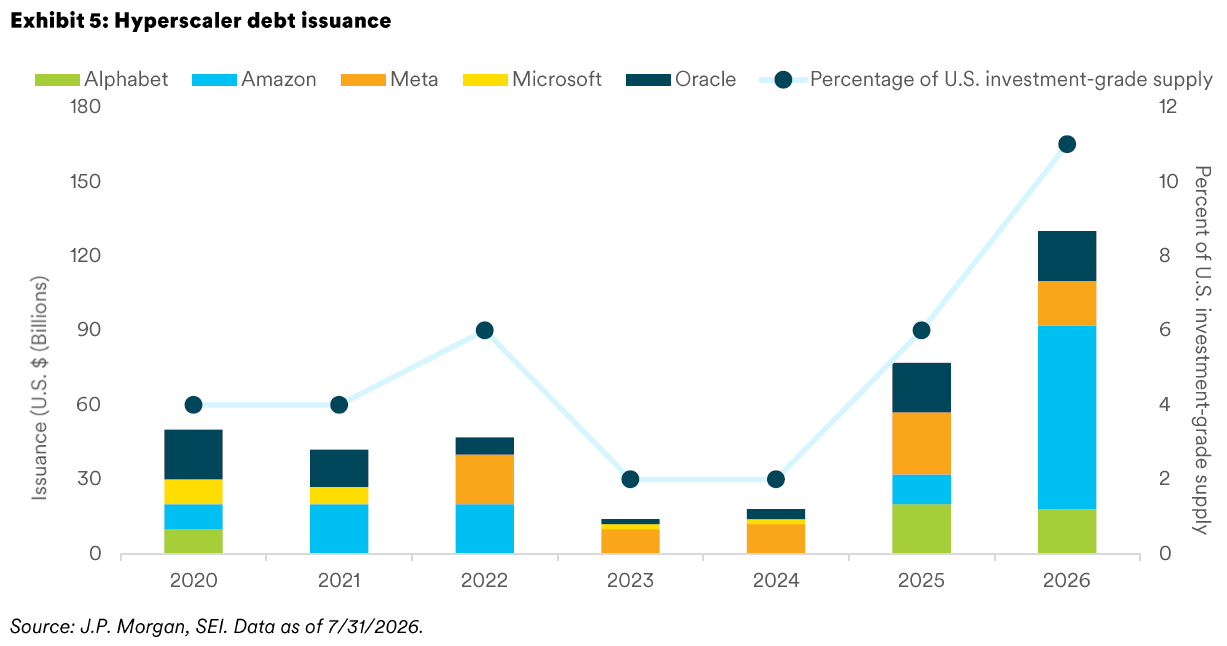
While the U.S. Treasury market remains substantially larger than the investment-grade corporate bond market at $11.7tn, elevated issuance from hyperscalers can influence investor demand as investors evaluate allocations between Treasuries and similarly high-quality corporate securities offering additional compensation.
Why does it matter if yields move higher?
The recent rise in 30-year U.S. Treasury yields has important implications for both the real economy and financial markets, as higher long-term interest rates may increase borrowing costs for governments, corporations, and households, potentially weighing on investment, consumption, and economic growth.
Elevated yields also have an impact on bond prices, which move inversely to yields. Equity markets may also face headwinds, as higher risk-free rates increase discount rates used in equity valuation models. This is a particular headwind for growth-oriented stocks as their profits are largely expected to be further in the future and therefore more sensitive to higher rates.
Beyond their impact on financing costs and asset prices, movements in the 30-year Treasury yield serve as an important barometer of investor confidence in the long-term outlook for inflation, fiscal policy, and economic stability.
Bessent attempting to steady the bond market
On August 19, U.S. Treasury Secretary Scott Bessent surprised markets by announcing an increase in the size of the Treasury’s buyback operations for longer-dated nominal U.S. government bonds. Beginning September 9, the Treasury will increase the maximum size of these operations from $2 billion to at least $4 billion, resulting in an estimated additional $14 billion of purchases during the current refunding quarter. The purchases will be concentrated in the 10- to 20-year and 20- to 30-year segments of the Treasury market. The announcement resulted in long-end yields falling by 9 bps and the broad yield curve flattening by a similar amount.
While the magnitude of the program remains modest relative to the overall Treasury market, the decision signals a growing recognition by policymakers of the challenges associated with financing large fiscal deficits in an environment of higher interest rates. The market is now watching closely to see whether the U.S. Treasury will step up its intervention efforts and what other measures will be deployed if long-end yields retest recent highs.
Current positioning
SEI currently maintains yield curve steepener positions across several portfolios. These positions are designed to benefit from higher yields at the long end of the curve relative to those at the short end. In contrast to the Fed’s quantitative easing program, the U.S. Treasury cannot create money to enact new purchases. Instead, the recently announced increase in long-dated Treasury buybacks must be financed through adjustments to the government's funding program, with a likely increase in issuance of short-dated securities. The extent of the Treasury's willingness to intervene further remains uncertain, despite recent reports suggesting it may expand buyback operations through its Treasury General Account. If the Treasury chooses to utilize its full toolkit and do so at meaningful scale, it could influence yield curve dynamics going forward. Such technical factors present the possibility to work against a yield curve steepener position, all else equal. While we have maintained our yield curve steepener positions to date, they remain under scrutiny as we assess whether Treasury actions can reverse the recent move in long-end yields or merely moderate the pace.
GLOSSARY AND INDEX DEFINITIONS
For financial term and index definitions, please see: https://www.seic.com/ent/imu-communications-financial-glossary
IMPORTANT INFORMATION
This material represents an assessment of the market environment at a specific point in time and is not intended to be a forecast of future events or a guarantee of future results. All information as of the date indicated. There are risks involved with investing, including possible loss of principal. This information should not be relied upon by the reader as research or investment advice, unless you have otherwise separately entered into a written agreement with SEI for the provision of investment advice nor should it be construed as a recommendation to purchase or sell a security. The reader should consult with their financial professional for more information.
Statements that are not factual in nature, including opinions, projections and estimates, assume certain economic conditions and industry developments and constitute only current opinions that are subject to change without notice. Nothing herein is intended to be a forecast of future events, or a guarantee of future results.
Certain economic and market information contained herein has been obtained from published sources prepared by other parties, which in certain cases have not been updated through the date hereof. While such sources are believed to be reliable, neither SEI nor its affiliates assumes any responsibility for the accuracy or completeness of such information and such information has not been independently verified by SEI.
This material is not directed to any persons where (by reason of that person's nationality, residence or otherwise) the publication or availability of this material is prohibited. Persons in respect of whom such prohibitions apply must not rely on this information in any respect whatsoever.
The information contained herein is for general and educational information purposes only and is not intended to constitute legal, tax, accounting, securities, research or investment advice regarding the strategies or any security in particular, nor an opinion regarding the appropriateness of any investment. This information should not be construed as a recommendation to purchase or sell a security, derivative or futures contract.
You should not act or rely on the information contained herein without obtaining specific legal, tax, accounting and investment advice from an investment professional.
The views contained herein are not to be taken as advice or a recommendation to buy or sell any investment in any jurisdiction. Our outlook contains forward-looking statements that are judgments based upon our current assumptions, beliefs, and expectations. If any of the factors underlying our current assumptions, beliefs or expectations change, our statements as to potential future events or outcomes may be incorrect. We undertake no obligation to update our forward-looking statements.
Information in the U.S. is provided by SEI Investments Management Corporation (SIMC), a wholly owned subsidiary of SEI Investments Company (SEI).
Information in Canada is provided by SEI Investments Canada Company, a wholly owned subsidiary of SEI Investments Company (SEI), and the Manager of the SEI Funds in Canada.
In the UK and the EEA this information issued in the UK by SEI Investments (Europe) Ltd, 1st Floor, Alphabeta, 14-18 Finsbury Square, London EC2A 1BR which is authorised and regulated by the Financial Conduct Authority. Investments in SEI Funds are generally medium- to long-term investments.
The contents of this document have not been reviewed by any regulatory authority in Hong Kong. You are advised to exercise caution in relation to the offer. If you are in any doubt about any of the contents of this document, you should obtain independent professional advice.
This document has not been registered as a prospectus with the Monetary Authority of Singapore.
This information is made available in Latin America, the Middle East and Australia FOR PROFESSIONAL (non-retail) USE ONLY by SIEL.
Any questions you may have in relation to its contents should solely be directed to your Distributor. If you do not know who your Distributor is, then you cannot rely on any part of this document in any respect whatsoever.
Issued in South Africa by SEI Investments (South Africa) (Pty) Limited, an authorised financial services provider (FSP No. 13186). This material is provided for general information and educational purposes only and does not constitute financial advice as contemplated in the Financial Advisory and Intermediary Services Act, 2002. It has not been prepared with regard to the investment objectives, financial situation or particular needs of any individual investor. Any reference to portfolio positioning represents SEI's investment views at the date of publication and may differ between portfolios and mandates. Investors should obtain appropriate professional advice before making an investment decision.