Global Value Stocks: Cheap, Boring and Scary Presents an Opportunity for Active Managers
Numerous studies have examined the historical outperformance of value investing. Benjamin Graham and David Dodd, widely considered the fathers of this approach, published a book in 1934—well before the invention of computers, machine learning or big data—that documented the benefits of investing in the value asset class. The major lesson learned from the Great Depression was obvious: Collective irrational expectations that lead investors to believe that market trends of the moment (whether rising or falling) will last forever helps to create opportunities for savvy individuals who break with the consensus view.
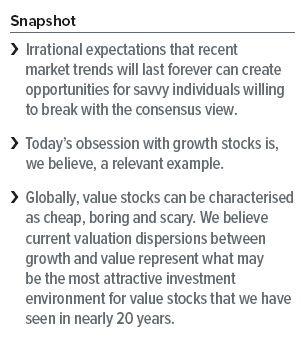
In the 1970s, amid increasing popularity of the efficient-market hypothesis—which dictates that market prices reflect all available information and outperformance of indexes is therefore impossible—celebrated investor Warren Buffett still carried the value baton. In his 1984 article, “The Superinvestors of Graham-and-Doddsville,” Buffett said, “Ships will sail around the world, but the Flat Earth Society will flourish. There will continue to be wide discrepancies between price and value in the marketplace, and those who read their Graham & Dodd will continue to prosper.”1
Years later, armed with data and computing power, academics Eugene Fama and Kenneth French (in 1992) as well as Josef Lakonishok, Andrei Shleifer and Robert Vishny (in 1994) measured and documented strong long-term returns for value securities in the US and in many other countries around the world—ultimately making a case that Graham, Dodd and Buffett were right all along. Still, this evidence did not deter investors from piling into internet stocks that had no earnings and zero book values in the late 1990s.
Fast forwarding to today, little appears to have changed in terms of investors’ collective irrational expectations. Once again, many are now being carried away by glorious visions of the long-term potential of technology companies (today’s darlings are social networking platforms, ride-hailing apps and fast-accelerating electric vehicles) despite the fact that many of these firms currently generate a steady stream of financial losses with no end in sight. We believe the current environment has created opportunities for savvy investors that are more abundant than they have been in 20 years.
Valid is not the same as risk-free
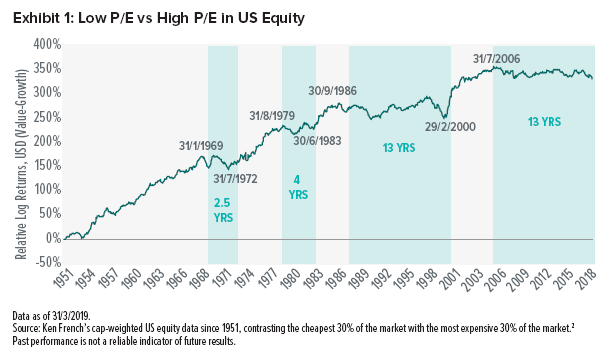
The validity of an investment approach must be measured over the long term if any recurring inefficiency is to be identified; opportunities could otherwise be arbitraged away as investors pile in to take advantage of short-term price dislocations. Exhibit 1 examines the long-term performance of a simple value metric, the price-to-earnings ratio (P/E), by looking at the relative returns of the 30% of stocks with the lowest P/E (value stocks) compared to the 30% with the highest P/E (growth stocks). The methodology’s long-term results are impressive. However, we can also imagine investors questioning its merits in 1972, 1983 and 2000 after sustained, multi-year drawdowns. The latest lag in value is prolonged but not unprecedented. We believe it presents the potential for an outsized rebound.
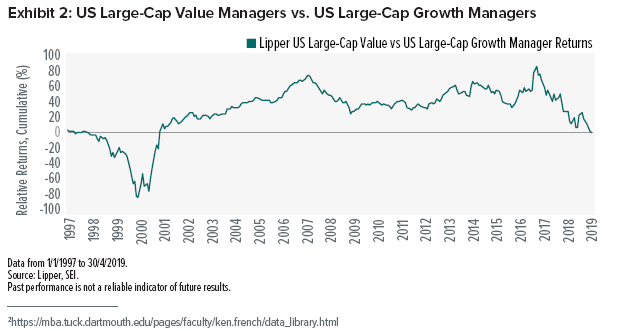
It is not surprising that the performance of value managers is closely related to the movement of value factors such as low P/E. US large-cap value managers, as a group, failed to participate in the inflation of the dot-com bubble, but they dramatically outperformed their growth counterparts when the bubble imploded in early 2000. Value managers also avoided liquidating their holdings at rock-bottom prices during the great financial crisis in 2008 and, consequently, offered solid performance relative to growth managers in the aftermath, as shown in Exhibit 2.
How coiled is that spring?
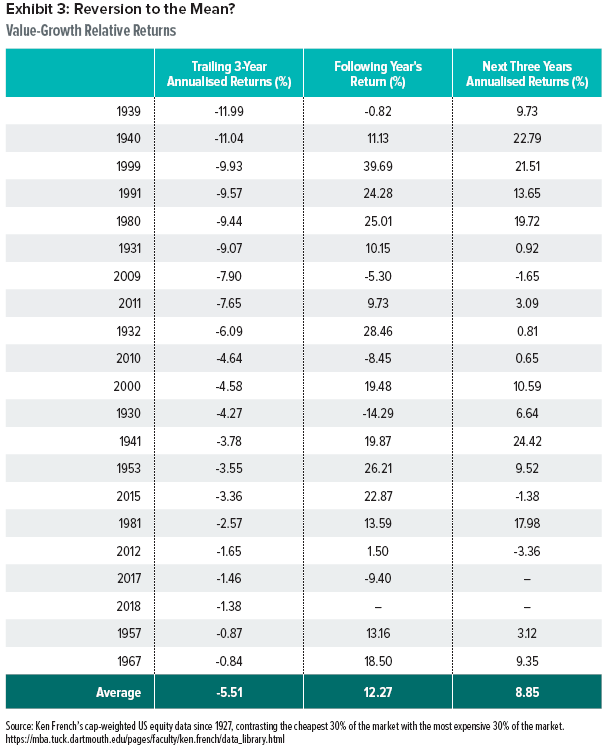
Periods in which value underperforms have historically been followed by outperformance. As shown in Exhibit 3, value has rebounded and outperformed over the following three years in more than 80% of these scenarios since 1927.
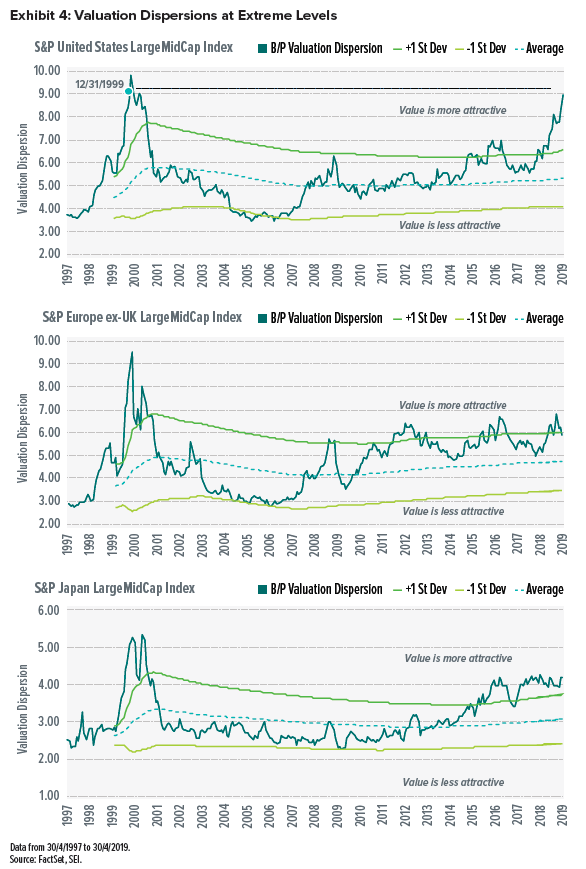
Valuation dispersion, the difference in valuation between the most expensive and cheapest parts of the market, serves as a reliable (but by no means perfect) metric of future outperformance potential. It’s a “greed and fear” gauge: Dispersion tends to rise as investors overpay for “glamour” or sell out of “cheap, boring and scary” and falls as individuals step back from greed and look to underlying fundamentals to support their investment decisions.
Value is currently attractive in most major equity markets, as illustrated in Exhibit 4. The technology and profitless initial-public-offering-heavy US market is a particularly striking example.
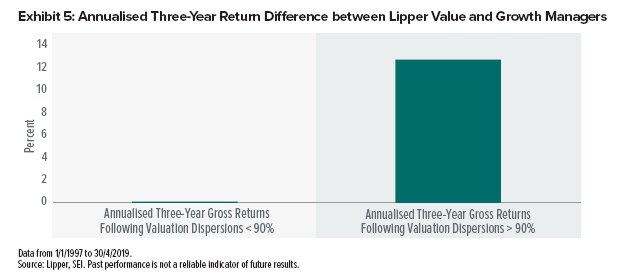
Looking at Lipper data from 1997 forward, we attempt to ascertain the relative return potential of value over growth managers following periods of extreme valuation dispersion like the one we see today. The results are striking: Following similarly attractive dispersions in the past, managers in the Lipper value group together realised 12% outperformance (annualised) over the growth cohort. It turns out that value managers (and the asset class itself) are not just cyclical in their performance, but also over an investment horizon of three years when compared to their returns following periods of smaller valuation dispersions, as seen in Exhibit 5.
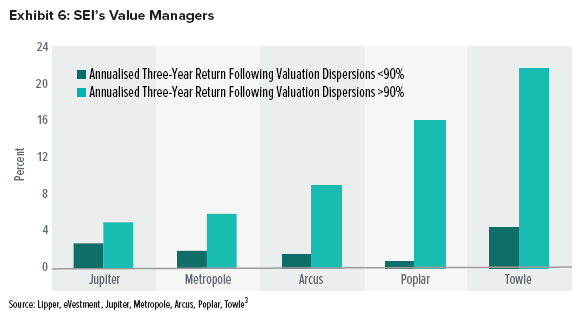
While past performance is not a reliable indicator of future results, applying the same methodology to SEI’s value managers in the SGIF Global Select Equity Fund (Jupiter Asset Management (Jupiter) in the UK, Metropole Gestion in Europe (Metropole), Arcus in Japan and Poplar Forest Capital (Poplar) and Towle & Co. (Towle) in the US) leads to similar conclusions: Greater returns have typically followed wide valuation dispersions. Exhibit 6 shows the returns of our value managers following historically-wide valuation dispersions compared to their performance in all other periods.
Looking for catalysts is futile
“Why now?” is one of the hardest questions in the investment industry. Just like a sandcastle is built higher and higher before collapsing, it is impossible to tell exactly when growth and value will change positions. Rising US interest rates in October 1972 (from what had been an all-time low) was only identifiable as a value driver after the fact, as was the Organization of the Petroleum Exporting Countries’ cut in oil prices in the early 1980s.
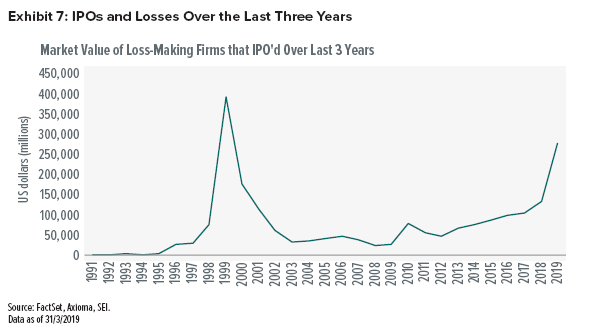
In March 2000, the tech bubble began its collapse after a “Burning Up” article in Barron’s indicated a quarter of internet stocks would burn through their cash within 12 months. As for today, any number of things could serve as the catalyst for value’s next run. In the US, rising interest rates or inflation would undoubtedly be helpful—earnings of glamorous high P/E stocks are worth much less today when discounted at a higher rate. It might also be cash-burning companies running out of easily impressionable investors. Exhibit 7 highlights the market value of loss-making firms that IPO’d over the most recent three-year period. Whatever the eventual rationale, the higher the sandcastle, the more likely it will soon collapse.
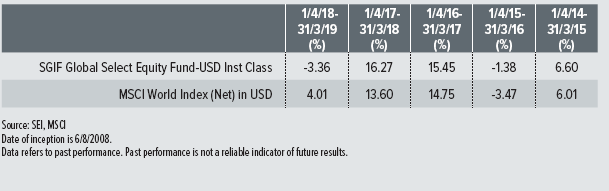
Standardised Performance as at 31 March 2019
Important Information
Data refers to past performance. Past performance is not a reliable indicator of future results.
Investments in SEI Funds are generally medium- to long-term investments. The value of an investment and any income from it can go down as well as up. Investors may get back less than the original amount invested. Returns may increase or decrease as a result of currency fluctuations. Additionally, this investment may not be suitable for everyone. If you should have any doubt whether it is suitable for you, you should obtain expert advice.
No offer of any security is made hereby. Recipients of this information who intend to apply for shares in any SEI Fund are reminded that any such application may be made solely on the basis of the information contained in the Prospectus. This material represents an assessment of the market environment at a specific point in time and is not intended to be a forecast of future events, or a guarantee of future results. This information should not be relied upon by the reader as research or investment advice regarding the funds or any stock in particular, nor should it be construed as a recommendation to purchase or sell a security, including futures contracts.
In addition to the normal risks associated with equity investing, international investments may involve risk of capital loss from unfavourable fluctuation in currency values, from differences in generally accepted accounting principles or from economic or political instability in other nations. Bonds and bond funds are subject to interest rate risk and will decline in value as interest rates rise. High yield bonds involve greater risks of default or downgrade and are more volatile than investment grade securities, due to the speculative nature of their investments. Narrowly focused investments and smaller companies typically exhibit higher volatility. SEI Funds may use derivative instruments such as futures, forwards, options, swaps, contracts for differences, credit derivatives, caps, floors and currency forward contracts. These instruments may be used for hedging purposes and/or investment purposes.
While considerable care has been taken to ensure the information contained within this document is accurate and up-to-date, no warranty is given as to the accuracy or completeness of any information and no liability is accepted for any errors or omissions in such information or any action taken on the basis of this information.
This information is issued by SEI Investments (Europe) Limited, 1st Floor, Alphabeta, 14-18 Finsbury Square, London EC2A 1BR which is authorised and regulated by the Financial Conduct Authority. Please refer to our latest Full Prospectus (which includes information in relation to the use of derivatives and the risks associated with the use of derivative instruments), Key Investor Information Documents and latest Annual or Semi-Annual Reports for more information on our funds. This information can be obtained by contacting your Financial Adviser or using the contact details shown above. SEI sources data directly from FactSet, Lipper, and BlackRock, unless otherwise stated.
The opinions and views in this commentary are of SEI only and are subject to change. They should not be construed as investment advice.


