Global economic growth and near-term prospects: A mixed track record. (Part 1) (Long Version)
The Quarterly Economic Outlook will be published in two installments. The current report focuses on global economic growth and near-term prospects for selected countries. The next report examines the outlook for inflation, government-policy responses, and the implication for interest rates and equity markets.
The global outlook: Slowly gaining steam
In light of a major American aircraft manufacturer’s recent struggles, it’s time to take a break from plane analogies (soft landing, hard landing, no landing) when talking about the economic outlook. So, let’s take a train instead. The U.S. appears to be chugging along quite nicely, posting solid gains that mostly have surprised to the upside. Most other major advanced economies, by contrast, seem to be stuck on a siding, hoping to at least hitch themselves to the mighty U.S. locomotive. The previous big engine in the world—China—still runs faster than the U.S., but it is no longer the bullet train that it once was.
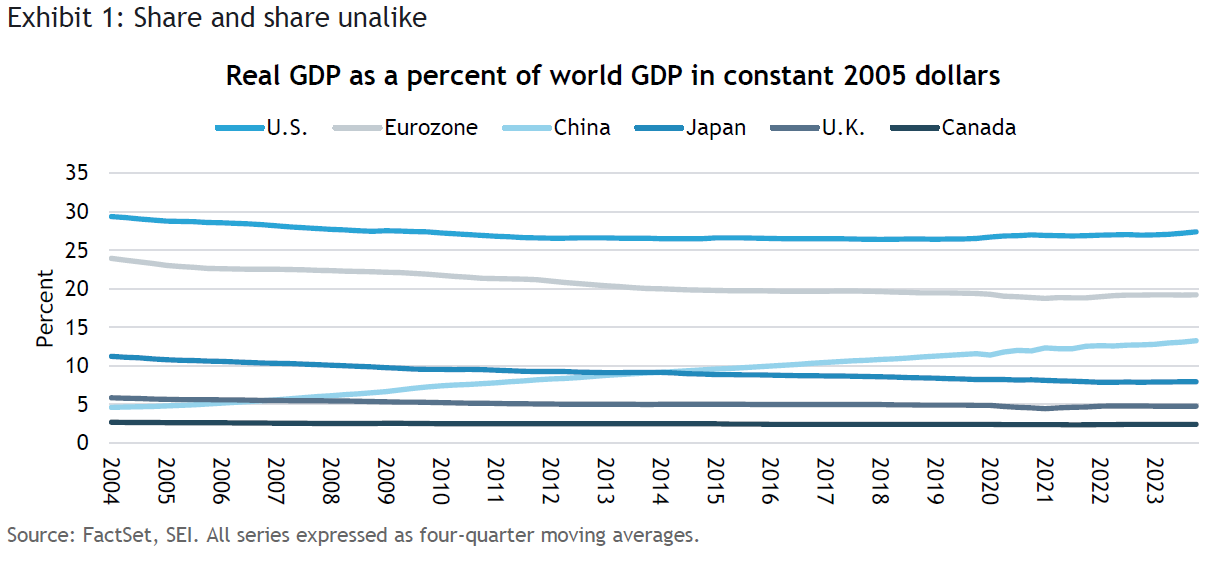
Exhibit 1 tracks inflation-adjusted gross domestic product (GDP), in 2005 U.S. dollars, as a percentage of world GDP for the U.S., the U.K., Canada, China, and the eurozone. While China continues to gain share (13% of world real GDP), it still lags the U.S. (27%) and the eurozone region (19%) by a considerable margin. The U.S. has recorded a modestly increasing share of world GDP volumes in recent years, reversing the downward/flatlining trend that had been in place between 2003 and 2019. The eurozone and Japan (7%), on the other hand, have seen their economies lose ground on a relative basis over the past two decades against the rest of the world. The U.K. (5%) also has lost some ground, but the decline in its share of real GDP immediately following Brexit, when the U.K. officially left the European Union early in 2020, has been mostly recovered. Canada, meanwhile, has exhibited remarkable steadiness in its 2% share of world GDP.
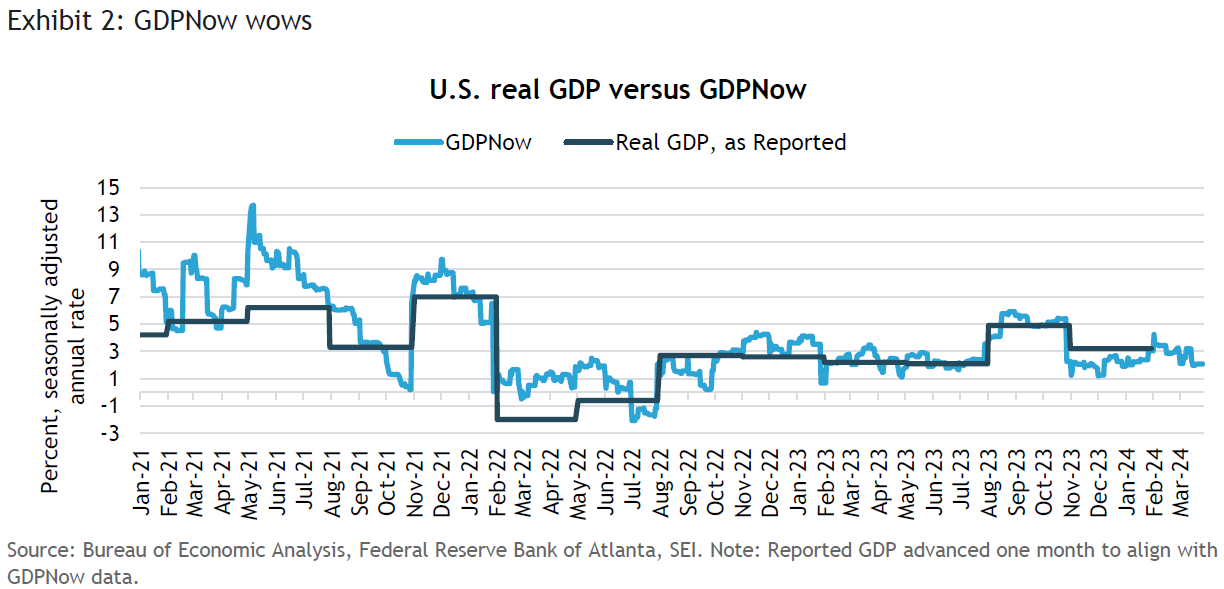
The U.S. economy got off to a fast start this year, as we highlight in Exhibit 2. According to the Federal Reserve Bank of Atlanta’s GDPNow statistic, a running tabulation of inflation-adjusted GDP that gets updated as new data roll in, the economy isn’t exactly a runaway train, but accelerated in January well above its long-term average growth potential of 2%. The most recent numbers have weakened somewhat, but U.S. growth is still running at a 2.1% annual pace so far this year as of March 26, 2024. In the fourth quarter of 2023, the U.S. reported a healthy gain of 3.1% from a year earlier, far outpacing most other major advanced economies.
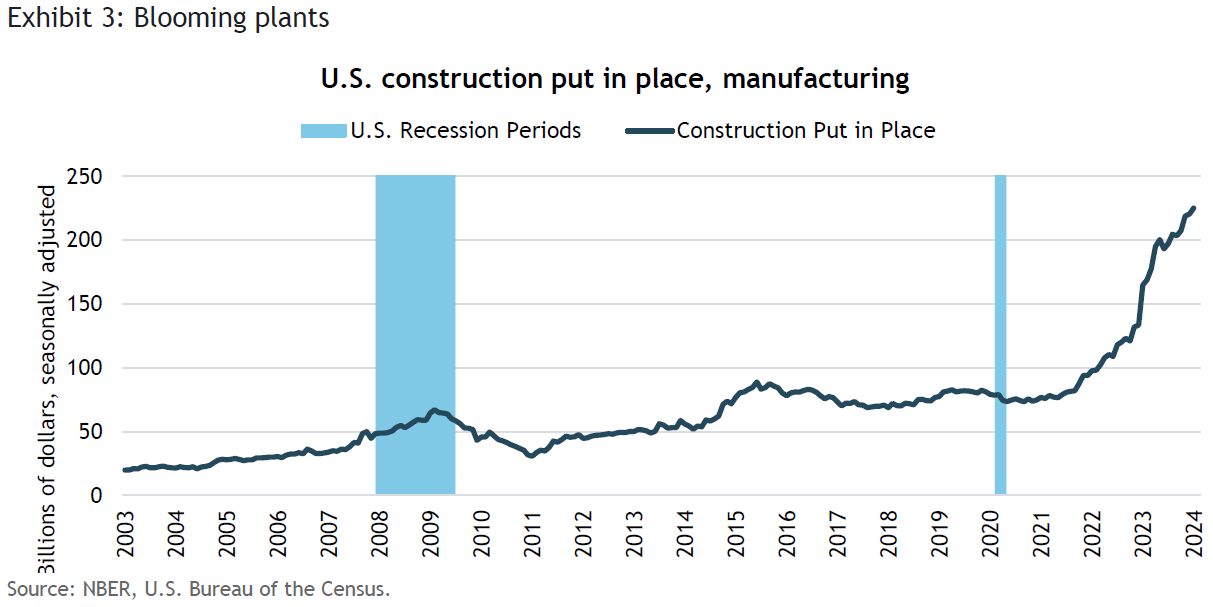
Although slowing from its previously fast pace, U.S. payroll employment continues to climb. The labor market remains tight, but quit rates are down and labor participation rates for prime-age workers (ages 25 to 54) are up. Total wages and salaries are still posting year-over-year gains of 5.5%. Depending upon the broad inflation measure one uses, this represents a real gain in aggregate incomes of 2–3% over the period. Government stimulus is also having a major impact. Not only are direct government expenditures rising sharply, but the incentives embedded in the Chips and Science Act and the Inflation Reduction Act have led to a massive spike in manufacturing plant construction, as we show in Exhibit 3. We should point out, however, that capital spending is more subdued outside of those industries favored by the Biden administration’s policies; spending on equipment fell modestly last year.
Economic growth in the U.S. will likely decelerate further, but there is little sign that a recession is looming. The steep rise in interest rates over the past two years will be felt to a greater degree as more households and businesses take out new loans or refinance existing obligations. In addition, the vast buildup of excess savings that occurred during the COVID-19 emergency has largely run out of steam. It has fallen to a level that no longer supports consumption in a meaningful way, at least for the lower-earning four-fifths of the population. They will now be dependent on the continued strength of the job market and income gains that exceed inflation. Note that delinquency rates on credit cards and consumer loans have been rising since the end of 2021, and are now above the levels immediately preceding the onset of COVID-19. This deterioration in financial strength probably is not enough to throw the economy off the rails and into recession. Until there is more substantial weakness in employment trends, we think U.S. consumers will remain on track.
Other major economies continue to struggle, although even here there are signs of modest improvement. The U.K. and Germany recorded slight declines in GDP in the third and fourth quarters of 2023, and for the year as a whole. Both countries were hit by downturns in manufacturing and construction, while stubborn inflation pressures limited the real gains in household incomes. Weighed down by the recessions in Germany, the Netherlands, and a few other countries, the eurozone region posted a mere 0.1% gain last year. On the other side of the Atlantic, Canada benefited from its proximity to the U.S., but grew at an annual rate of just 1% in the fourth quarter of 2023, and 0.9% for the year as a whole.
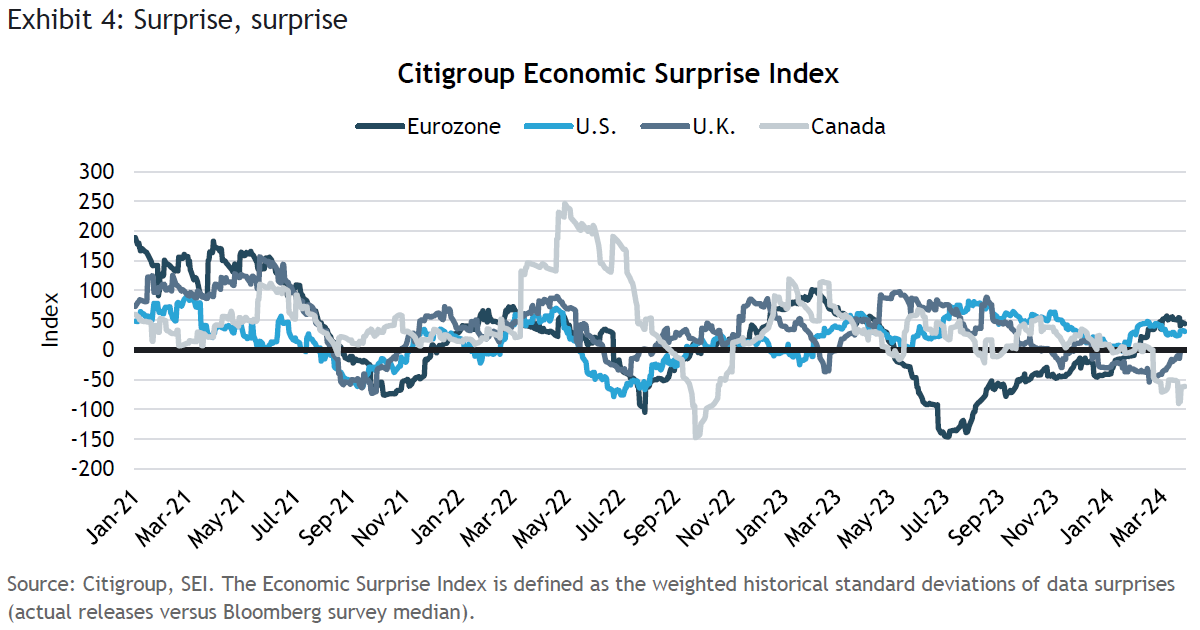
Exhibit 4 tracks the Citigroup Economic Surprise Index for the U.S., the U.K., Canada, and the eurozone. While it is hardly a surprise that the U.S. has been surprising to the upside, the eurozone has been doing the same. This simply illustrates how low the bar has been set for these economies. Canada and the U.K., by contrast, have been posting disappointing economic data as of late, although both countries appear to have enjoyed a weather-related bounce in real GDP during January.
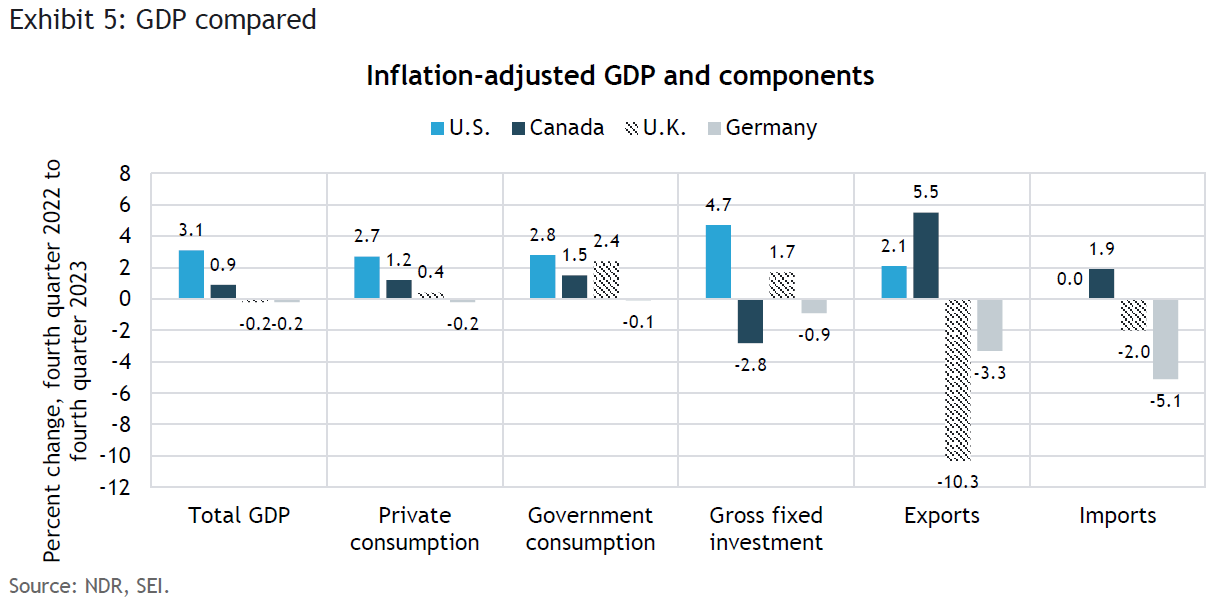
As we show in Exhibit 5, both Canada and the U.K. performed quite poorly last year across the major components of GDP relative to the U.S. One reason for the divergence in performance is greater sensitivity to the rise in interest rates, hurting household consumption. Fiscal policy also has provided a much smaller boost to growth compared the U.S. Unique factors to each country also have come into play. Canadian households, for example, never deleveraged their balance sheets following the Global Financial Crisis (2007-2009), and thus have been stressed by the sharp rise in interest rates over the past two years. Homebuilding in Canada has been hit hard, with home-construction spending plummeting from more than 9% of GDP in early 2021 to 6.4% by the fourth quarter of last year. The U.K., meanwhile, continues to struggle with strike disruptions and an inflation rate that continues to run at higher levels than those of other advanced economies. Brexit, and the train wreck it created with regard to trade with the European Union, also is an important factor constraining business activity.
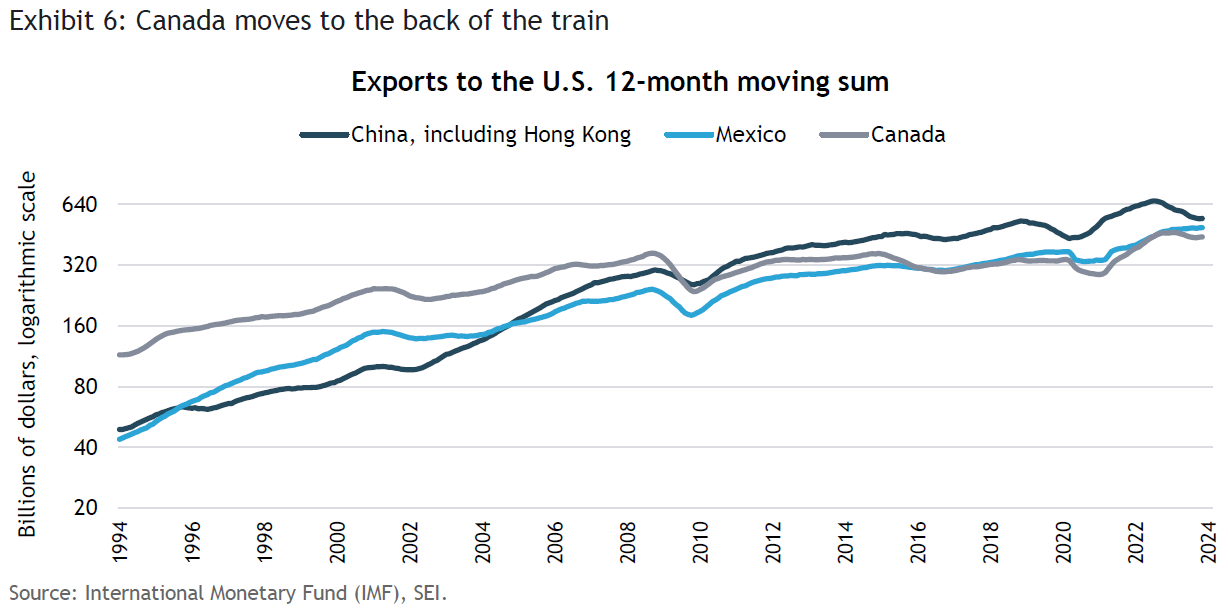
Canada historically has been coupled to the U.S. As we show in Exhibit 6, in the past, it exported more to the U.S. than any other country. However, it lost its number one position to China in 2009, and in 2022 fell into third place behind Mexico. Trade frictions between the U.S. and China, aggravated by COVID-19 lockdowns in the latter, have led to a sharp decline in Chinese exports to the U.S. since 2022. Mexico, by contrast, continues to gain export share. It will likely continue to be a big beneficiary of the trend toward nearshoring, given the competitive advantages bestowed upon it by the United States-Mexico-Canada Agreement on free trade (which took the place of the better-known North America Free Trade Agreement (NAFTA)).
Germany: Struggling to engineer a way out
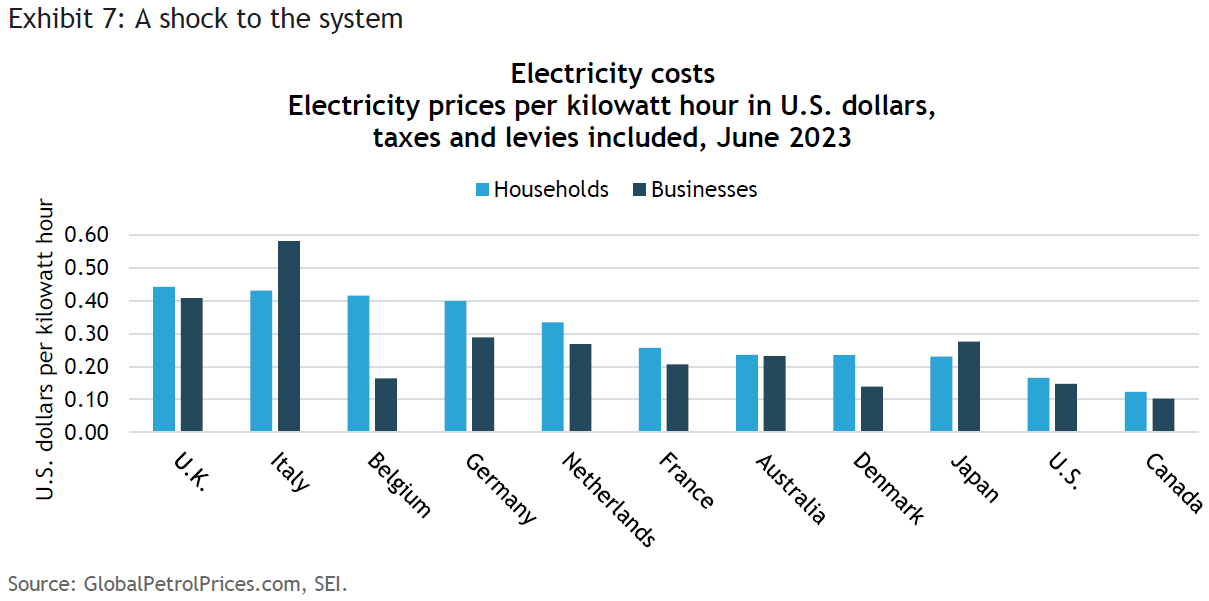
Germany faces serious challenges of its own. For the first time since the early 1990s, when the country struggled to integrate the former East Germany into West Germany, the economy appears to be in a multiyear morass. Although it has done a good job in building up its capacity to import liquefied natural gas from the U.S., Qatar, and elsewhere, it still is saddled with high electricity costs. Exhibit 7 highlights the price of electricity, including various environmental and fuel cost charges and taxes, facing households and businesses. Among the major economies, only the U.K. and Italy face higher household and business rates. Note that both households and businesses in the U.S. and Canada enjoy some of the lowest electricity prices among developed countries. This is a major competitive advantage that is unlikely to fade anytime soon.
Germany’s heavy exposure to manufacturing, previously an asset, has now become a liability. First came the massive disruption to supply chains caused by COVID-19. Then came the energy shock as natural gas prices soared in the immediate aftermath of Russia’s invasion of Ukraine. China’s economic woes have also hurt German manufacturing, reducing exports of cars and industrial capital goods to Chinese consumers and companies. Meanwhile, a rising tide of cheap Chinese electric-vehicle imports is adding to the pressures faced by German automakers.
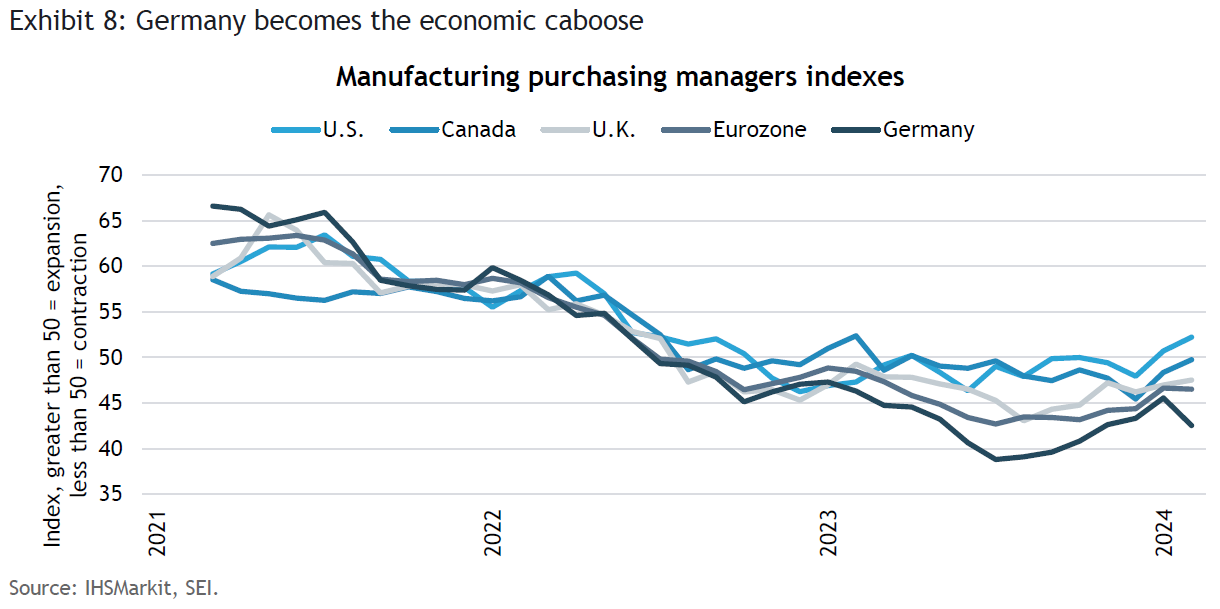
Although surveys of purchasing managers in manufacturing industries across the developed world are indicating a contraction in activity (the U.S. is again the exception), Germany stands out as the weakest link. Exhibit 8 highlights how Germany endured a sharp month-to-month decline in February, while the U.S., the U.K., and Canada all showed improvement.
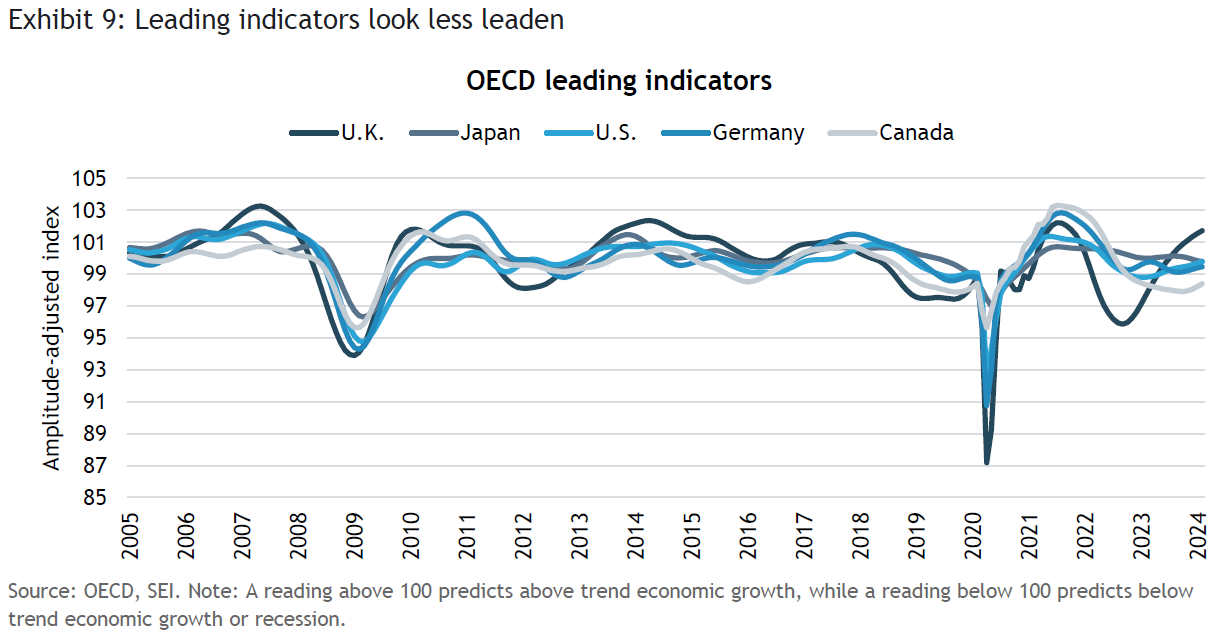
While it is likely that the major economies will continue to be slow or stagnant, there are a few positive signs. The Organisation for Economic Co-operation and Development (OECD) reports a bottoming out of the Leading Indicators for the biggest countries, which we show in Exhibit 9. The U.K. has seen the sharpest improvement in its Composite Index of Leading Indicators (CLI), suggesting that above-trend economic performance might lie ahead. Among the positive straws in the wind: a recovery in the services-sector purchasing managers’ survey, an improvement in business sentiment, and a decline in consumer debt as a percentage of GDP to a 20-year low. Stock prices, as measured by the total return of the MSCI United Kingdom Index, are up 12% over the past year in local-currency terms. The currency also has strengthened about 4% since October 2023.
The outlook for Germany appears less promising. Purchasing managers in the manufacturing, construction, and services sectors are still reporting contractionary conditions. Car production is bouncing along at low levels, with German manufacturers hit by the double whammy of surging imports of cheap Chinese electric vehicles and stagnant exports to China.
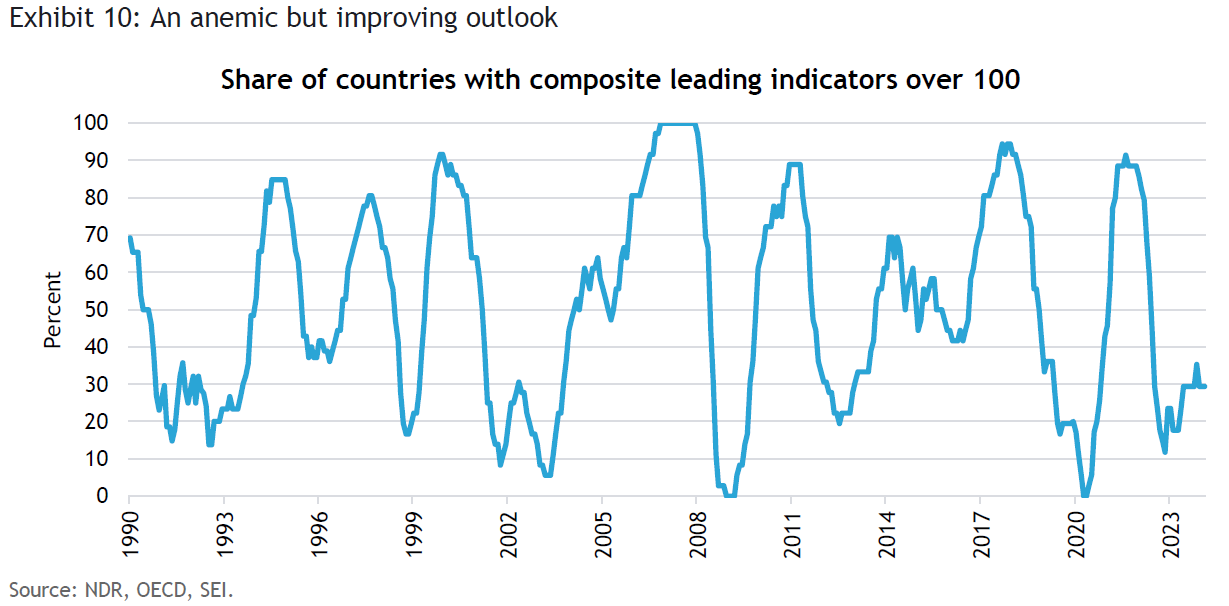
For a broader perspective, we highlight the OECD’s Composite Leading Indicator (CLI) diffusion index in Exhibit 101. The statistic tracks 17 economies (12 OECD-members plus five large non-member countries) reporting a CLI over 100. The diffusion index shows that a slowly increasing percentage of countries is reporting an above-trend outlook since November 2022. However, at less than 30% of the countries in the survey, overall global economic prospects still appear tepid, at best. Besides the U.K., the other countries reporting CLIs above 100 include Korea and Mexico (both OECD-member countries), as well as China and Brazil.
China: The big engine that couldn’t
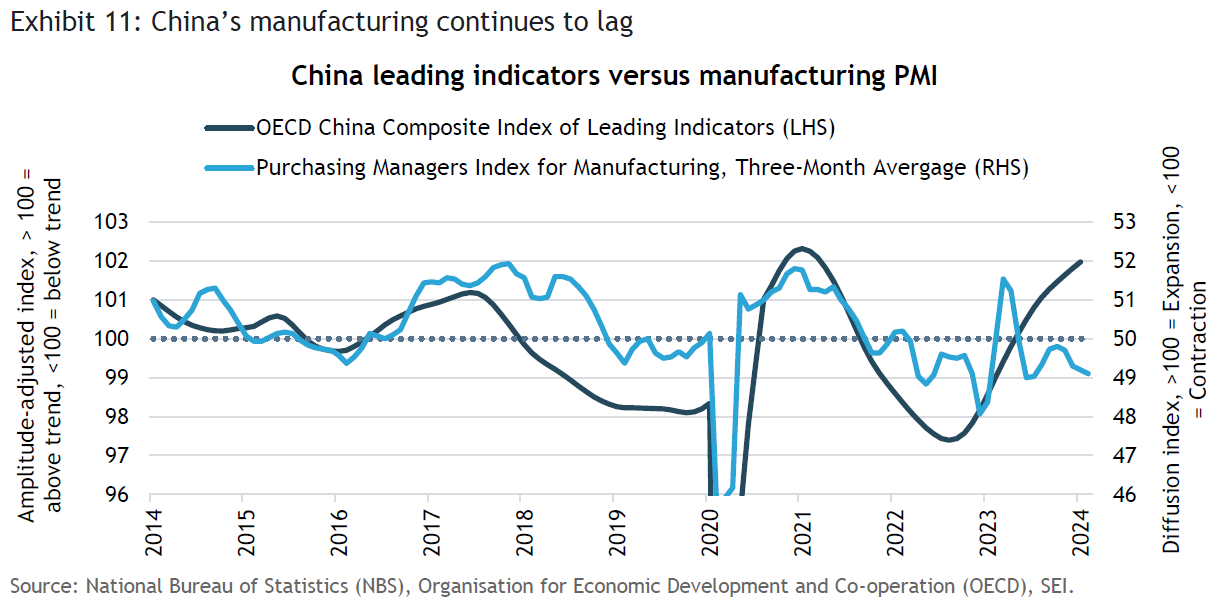
Although the China Composite Leading Indicator suggests improvement, we think it will take a while for that improvement to show up broadly and sustainably in the country’s industrial activity. Exhibit 11 compares the OECD’s CLI to China’s Purchasing Managers Index (PMI) for manufacturing activity over the past 10 years. Movements in the OECD measure have tended to lead those of the PMI survey, although both series moved together during the COVID-19 downturn and subsequent recovery in 2020. The next cyclical downturn in China, at the start of the second COVID-19 wave in early 2021, also was concurrent. The leading indicators bottomed out in August 2022, while the manufacturing PMI didn’t hit its trough until December 2022. The PMI series has been quite volatile over the past year, but mostly has been fluctuating below the 50 line, suggesting continued contraction in the manufacturing sector.
Construction also remains in the doldrums as China works through its property bubble and debt-related issues. Real-estate floor space under construction fell 7.4% last year, its worst annual decline of the past three years. All three major building sectors—non-office commercial (-9.7%), residential (-7.8%), and office (-5.1%)—lost further ground. By comparison, total real-estate floor space under construction grew between 20% and 40% annually between 2000 and 2012.
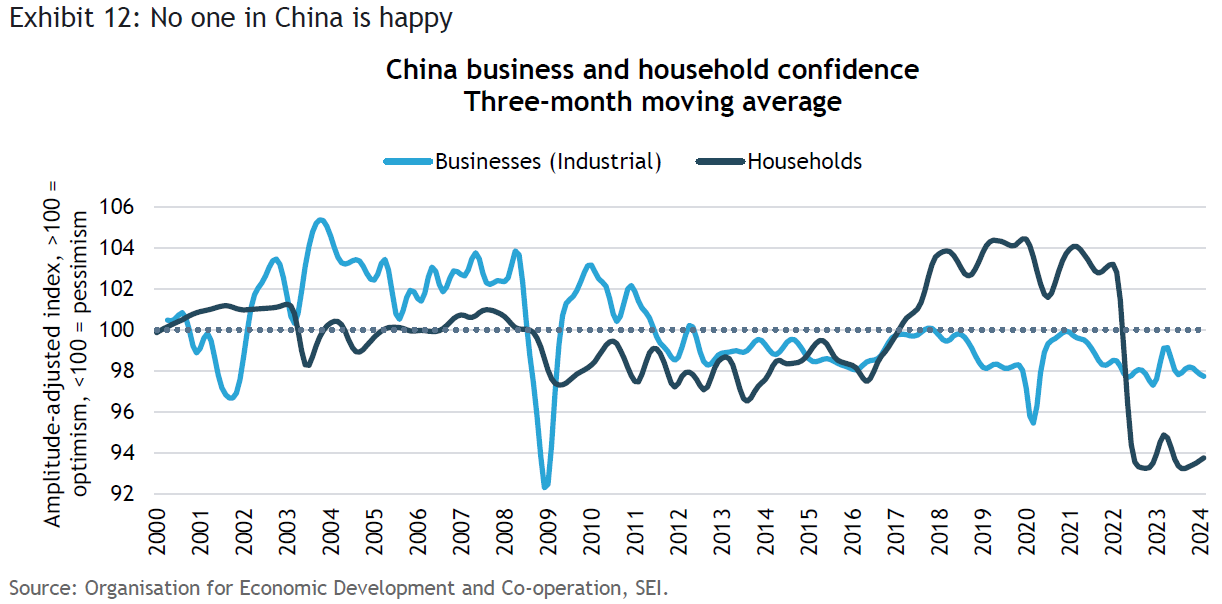
Consumer and business confidence, highlighted in Exhibit 12, also remain quite depressed. Household sentiment is especially poor, hovering near the lows reached during the last COVID-19 lockdown in the final months of 2022. The current pessimism contrasts quite sharply with the optimism expressed in the years just prior to, and even during, the COVID-19 outbreak. Business sentiment has been more stable, but nonetheless has been stuck at the low end of its historical range in recent years.
The sour mood helps to explain why the government’s modest efforts to support the economy—through lower interest rates, reductions in banks’ required reserve ratios, tax cuts, infrastructure spending, and measures to bolster the housing market—have yet to pay off. However, the central government has thus far been reluctant to devise an aggressive bailout of debt-burdened local governments or deal decisively with the property crisis. This hardline approach may be starting to change, however. The central government may soon begin to issue special long-term bonds in order to alleviate the balance-sheet pressures facing local governments, according to Oxford Economics. Since these governments have been running a deficit of more than 10% of GDP in recent years, the shift in budgetary financing under consideration is potentially quite impactful.
Optimists on the Chinese economy can point to relatively robust consumer spending during the Chinese Lunar New Year celebrations. Internal travel and recreational activities such as going to see a movie, dining out, and gift -giving have been strong this year. The stock market has also rebounded nicely since late January, but it is recovering from exceedingly low levels. On a year-to-date basis, the total return of the MSCI China Index is basically flat, compared to a 6% gain in the MSCI ACWI Index.
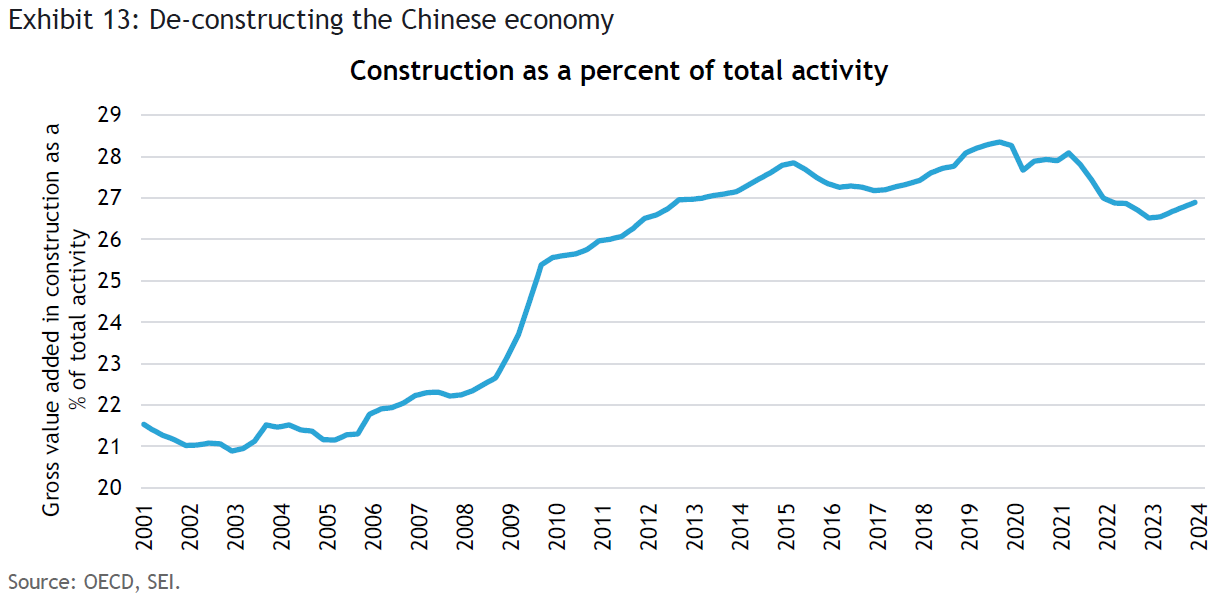
The debt overhang at the local government level and the overbuilding that occurred in years past are now coming back to bite the country’s economy. While China’s problems are not an exact replay of the Global Financial Crisis, there are similarities because it will take time for households, businesses, and local governments to deleverage and repair their balance sheets. It took the U.S. close to 10 years to get out from under its debt and real-estate issues, as banks were forced to retrench and households reduced their debt burdens. Exhibit 13 shows that construction as a percentage of the country’s gross value added remains quite high, especially compared to the levels that prevailed before the 2006-2015 housing and infrastructure boom. Even if the Chinese central government follows this train of thought and becomes more aggressive in its rescue efforts, it could take several more years before the economy achieves a better balance.
Japan: Back on track
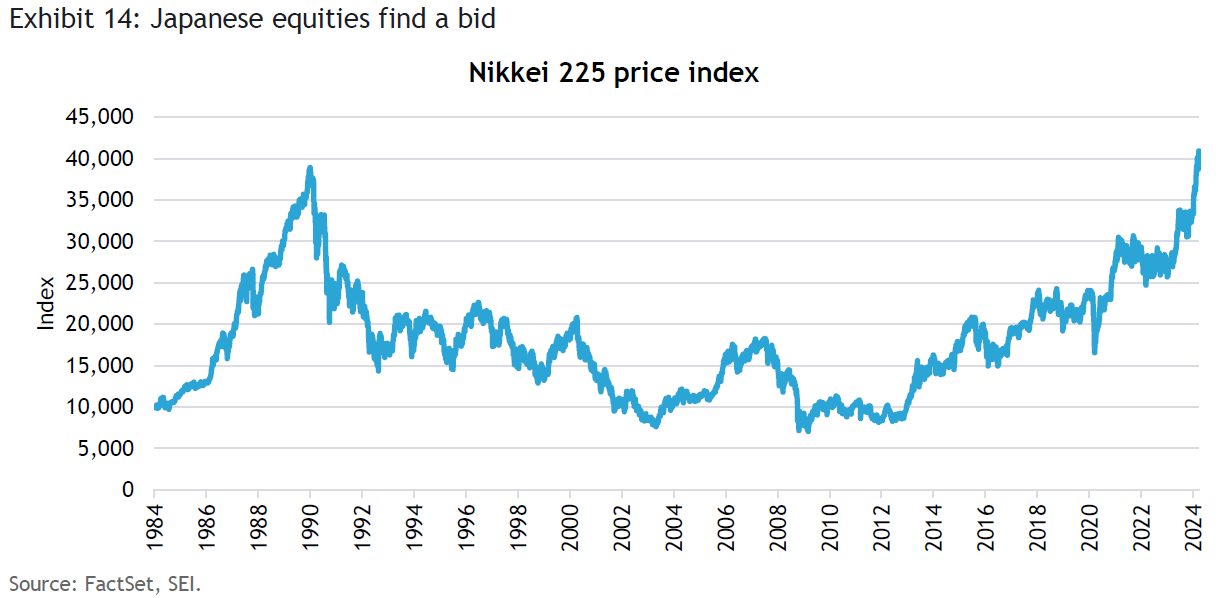
Investors are starting to pay attention to Japan. Perhaps they should have done so sooner. The price-weighted Nikkei 225 index, highlighted in Exhibit 14, recently broke into record territory—for the first time since December 31, 1989. Back in the 1980s, equity and property prices were caught in epic bubbles. When these burst, it ushered in a long period of economic decline, deflation, and an 80% tumble in the broad stock market.
The turnaround in equity prices began around 2013, with former Prime Minister Shinzo Abe’s major economic and financial-market reforms, known as “The Three Arrows.” This three-pronged approach emphasized aggressive fiscal expansion, easy money (including ultra-low interest rates and massive asset purchases by the Bank of Japan), and structural reforms (cutting corporate taxes, liberalizing markets, and instituting shareholder-friendly regulatory changes, among other initiatives).
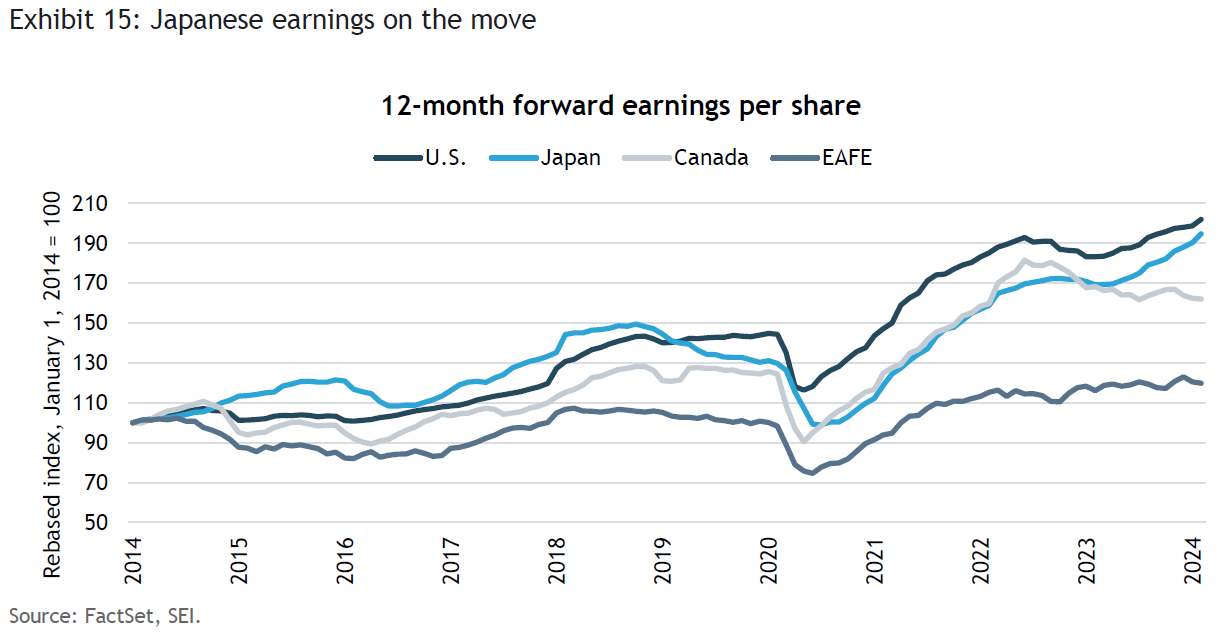
The recovery from the bursting financial and property bubbles proved extremely difficult, however. The economy continues to be constrained by the country’s poor demographics and conservative culture—not to mention some self-inflicted wounds, including increases in the national sales tax in 2014 and 2019. Nonetheless, analysts’ year-ahead earnings-per-share estimates have risen vigorously over the past 10 years. Exhibit 15 compares the trend in forward earnings as calculated by MSCI for Japan, the U.S., Canada, and Europe, Australasia, and the Far East (EAFE). (EAFE covers 21 developed markets, excluding the U.S. and Canada.) Japan’s forward-looking earnings per share in local-currency terms has almost kept pace with the U.S. over this time, while EAFE earnings have lagged badly. Of course, when currency fluctuations are taken into account, the earnings trend in Japan appears far weaker relative to the U.S., owing to the yen’s 30% cumulative decline against the greenback over this 10-year period.
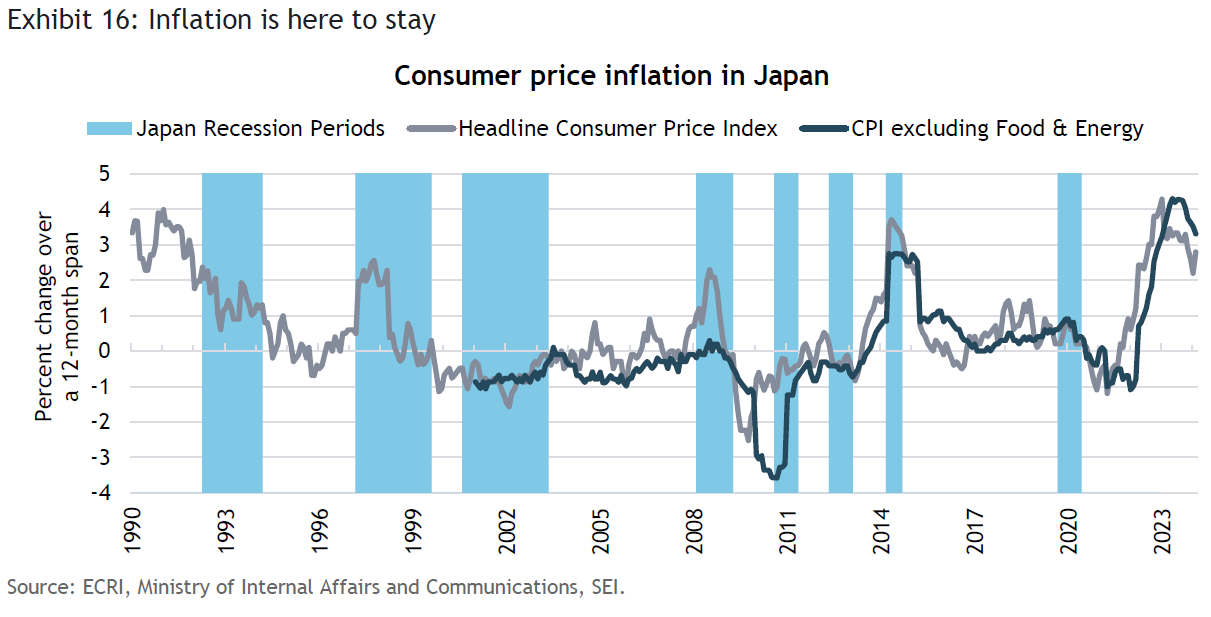
At long last, Japan has shaken off its deflationary tendencies. Although headline consumer prices have fallen sharply over the past year as a result of lower energy costs and an easing of food inflation, the recent rebound in petroleum prices suggests that overall inflation is unlikely to decline much further. Note that the headline consumer-price index rebounded in February, posting a year-over-year gain of 2.8% in February compared to January’s reading of only 2.2%. More importantly, core prices are still quite elevated. This is highlighted in Exhibit 16.
The annual negotiations conducted between the country’s biggest companies and their unions have led to some eye-popping wage settlements, with an average increase of nearly 5.3%. That would represent the biggest average wage hike in a generation. Since productivity growth has been growing at a subdued pace in recent years, we would not be surprised to see underlying inflation continue to run in a 3–4% range in the year ahead. Japan’s inflation in the near term also may be exacerbated by the sharp decline in the yen against the U.S. dollar and other major currencies this year.
In summary, the global economic outlook still looks quite mixed, but there are scattered signs of modest improvement. The U.S. is the locomotive still leading the way, but other countries—the U.K., Canada, and Japan, for example—could pick up some steam in the months ahead. One big question mark is China. The cyclical outlook should improve, but the structural challenges are immense. If the government enacts more stimulative policy, it could provide an important boost to global growth.
Glossary
Brexit is a combination of “Britain” and “exit,” referring to the U.K.’s withdrawal from the European Union on January 31, 2020.
The Global Financial Crisis (GFC) refers to the period of extreme stress in global financial markets and banking systems between mid-2007 and early 2009.
Gross domestic product (GDP) is the total monetary or market value of all the goods and services produced in a country during a certain period.
Index definitions
The Citigroup Economic Surprise Index measures the degree to which a core set of economic data series has been coming in under expectations, at expectations, or over expectations.
The MSCI ACWI is a market capitalization-weighted index that tracks the performance of over 2,000 companies and is representative of the market structure of 48 developed and emerging-market countries in North and South America, Europe, Africa, and the Pacific Rim. The index is calculated with net dividends reinvested in U.S. dollars.
The MSCI China Index (total return) tracks the performance (including reinvested dividends) of large- and mid-cap stocks in China. The Index’s 151 constituents comprise about 85% of the China equity universe.
The MSCI United Kingdom Index is a free-float-adjusted market-capitalization-weighted index that is designed to measure the performance of the large- and mid-cap segments of the U.K. market. With 111 constituents, the index covers approximately 85% of the free float-adjusted market capitalization in the U.K.
The Nikkei 225 is a price-weighted index (i.e., each company comprises a percentage of the total index proportional to its share price) that tracks the performance of 225 stocks listed on the Tokyo Stock Exchange Prime Market.
A purchasing managers’ index (PMI) tracks the prevailing direction of economic trends in the manufacturing and service sectors.
OECD’s Composite Leading Indicator (CLI) diffusion index represents the proportion of countries whose OECD CLI is rising or unchanged. Composite leading indicators are designed to provide early signals of turning points in business cycles showing fluctuation of the economic activity around its long-term potential level. CLIs show short-term economic movements in qualitative rather than quantitative terms.
Important information
This material represents an assessment of the market environment at a specific point in time and is not intended to be a forecast of future events, or a guarantee of future results. Positioning and holdings are subject to change. All information as of the date indicated. There are risks involved with investing, including possible loss of principal. This information should not be relied upon by the reader as research or investment advice, (unless you have otherwise separately entered into a written agreement with SEI for the provision of investment advice) nor should it be construed as a recommendation to purchase or sell a security, including futures contracts. The reader should consult with their financial professional for more information.
Statements that are not factual in nature, including opinions, projections and estimates, assume certain economic conditions and industry developments and constitute only current opinions that are subject to change without notice. Nothing herein is intended to be a forecast of future events, or a guarantee of future results.
Certain economic and market information contained herein has been obtained from published sources prepared by other parties, which in certain cases have not been updated through the date hereof. While such sources are believed to be reliable, neither SEI nor its affiliates assumes any responsibility for the accuracy or completeness of such information and such information has not been independently verified by SEI.
There are risks involved with investing, including loss of principal. The value of an investment and any income from it can go down as well as up. Investors may get back less than the original amount invested. Returns may increase or decrease as a result of currency fluctuations. Past performance is not a reliable indicator of future results. Investment may not be suitable for everyone.
Diversification does not ensure a profit or guarantee against a loss. International investments may involve risk of capital loss from unfavorable fluctuation in currency values, from differences in generally accepted accounting principles or from economic or political instability in other nations. Emerging markets involve heightened risks related to the same factors as well as increased volatility and lower trading volume. Narrowly focused investments and smaller companies typically exhibit higher volatility. Bonds and bond funds will decrease in value as interest rates rise. High-yield bonds involve greater risks of default or downgrade and are more volatile than investment-grade securities, due to the speculative nature of their investments.
Index returns are for illustrative purposes only and do not represent actual portfolio performance. Index returns do not reflect any management fees, transaction costs or expenses. One cannot invest directly in an index.
This material is not directed to any persons where (by reason of that person's nationality, residence or otherwise) the publication or availability of this material is prohibited. Persons in respect of whom such prohibitions apply must not rely on this information in any respect whatsoever.
The information contained herein is for general and educational information purposes only and is not intended to constitute legal, tax, accounting, securities, research or investment advice regarding the strategies or any security in particular, nor an opinion regarding the appropriateness of any investment. This information should not be construed as a recommendation to purchase or sell a security, derivative or futures contract. You should not act or rely on the information contained herein without obtaining specific legal, tax, accounting and investment advice from an investment professional.
SEI sources data directly from FactSet, Lipper, and BlackRock unless otherwise stated.
Information provided by SEI Investments Management Corporation, a wholly owned subsidiary of SEI Investments Company (SEI). They should not be construed as investment advice.
Information provided in Canada by SEI Investments Canada Company, the Manager of the SEI Funds in Canada.
Information issued in the UK by SEI Investments (Europe) Limited, 1st Floor, Alphabeta, 14-18 Finsbury Square, London EC2A 1BR which is authorised and regulated by the Financial Conduct Authority. Investments in SEI Funds are generally medium- to long-term investments.
This document has not been registered by the Registrar of Companies in Hong Kong. In addition, this document may not be issued or possessed for the purposes of issue, whether in Hong Kong or elsewhere, and the Shares may not be disposed of to any person unless such person is outside Hong Kong, such person is a “professional investor” as defined in the Ordinance and any rules made under the Ordinance or as otherwise may be permitted by the Ordinance.
The contents of this document have not been reviewed by any regulatory authority in Hong Kong. You are advised to exercise caution in relation to the offer. If you are in any doubt about any of the contents of this document, you should obtain independent professional advice.
This information is made available in Latin America and the Middle East FOR PROFESSIONAL (non-retail) USE ONLY by SIEL.
Any questions you may have in relation to its contents should solely be directed to your Distributor. If you do not know who your Distributor is, then you cannot rely on any part of this document in any respect whatsoever.
Issued in South Africa by SEI Investment (South Africa) (Pty) Limited FSP No. 13186 which is a financial services provider authorised and regulated by the Financial Sector Conduct Authority (FSCA). Registered office: 3 Melrose Boulevard, 1st Floor, Melrose Arch 2196, Johannesburg, South Africa.
This material is intended for information purposes only and the information in it does not constitute financial advice as contemplated in terms of the Financial Advisory and Intermediary Services Act.
SIEL is not licensed under Israel’s Regulation of Investment Advising, Investment Marketing and Portfolio Management Law, 5755-1995 (the “Advice Law”) and does not carry insurance pursuant to the Advice Law. No action has been or will be taken in Israel that would permit a public offering or distribution of the SEI Funds mentioned in this email to the public in Israel. This document and any of the SEI Funds mentioned herein have not been approved by the Israeli Securities Authority (the “ISA”).
SEI Investments Canada Company, a wholly owned subsidiary of SEI Investments Company, is the Manager of the SEI Funds in Canada.
The information contained herein is for general and educational information purposes only and is not intended to constitute legal, tax, accounting, securities, research or investment advice regarding the Funds or any security in particular, nor an opinion regarding the appropriateness of any investment. This commentary has been provided by SEI Investments Management Corporation (“SIMC”), a U.S. affiliate of SEI Investments Canada Company. SIMC is not registered in any capacity with any Canadian regulator, nor is the author, and the information contained herein is for general information purposes only and is not intended to constitute legal, tax, accounting, securities, or investment advice, nor an opinion regarding the appropriateness of any investment. You should not act or rely on the information contained herein without obtaining specific legal, tax, accounting and investment advice from qualified professionals. This information should not be construed as a recommendation to purchase or sell a security, derivative or futures contract. You should not act or rely on the information contained herein without obtaining specific legal, tax, accounting and investment advice from an investment professional. This material represents an assessment of the market environment at a specific point in time and is not intended to be a forecast of future events, or a guarantee of future results. There is no assurance as of the date of this material that the securities mentioned remain in or out of the SEI Funds.


